Figure 3:

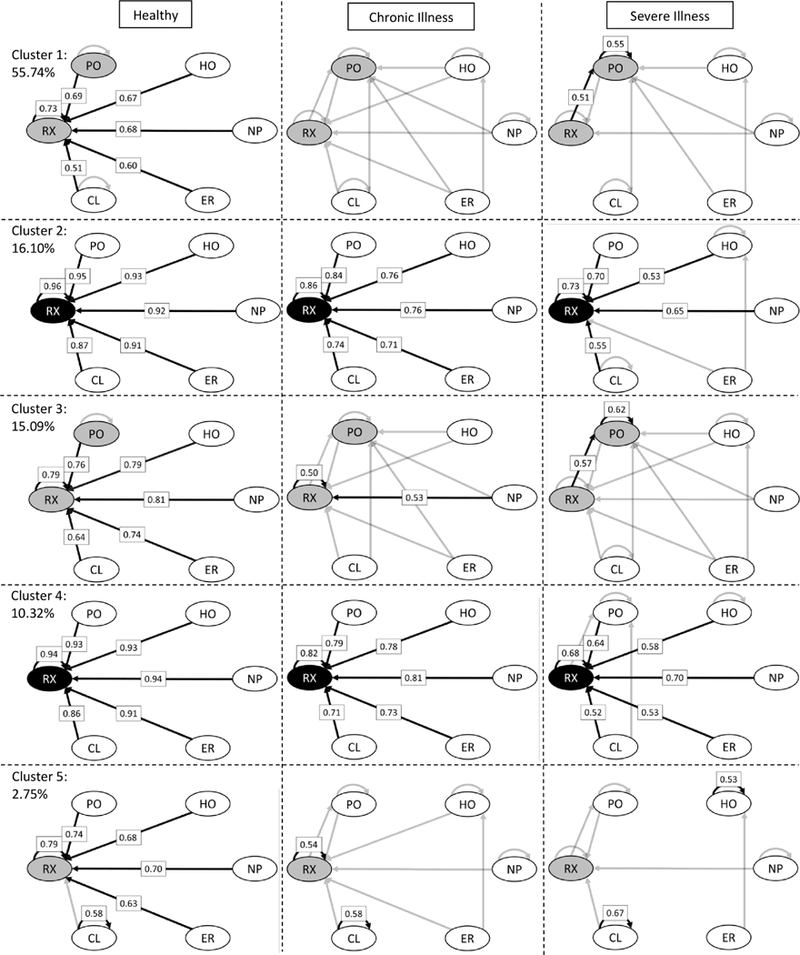
Provider networks inferred from the proportional hazards coefficients. The following rules were used in setting the grayscale of the coefficients and nodes: < 0.2 → not shown/white, [0.2, 0.5) →gray, and ≥ 0.5 → black.

Provider networks inferred from the proportional hazards coefficients. The following rules were used in setting the grayscale of the coefficients and nodes: < 0.2 → not shown/white, [0.2, 0.5) →gray, and ≥ 0.5 → black.