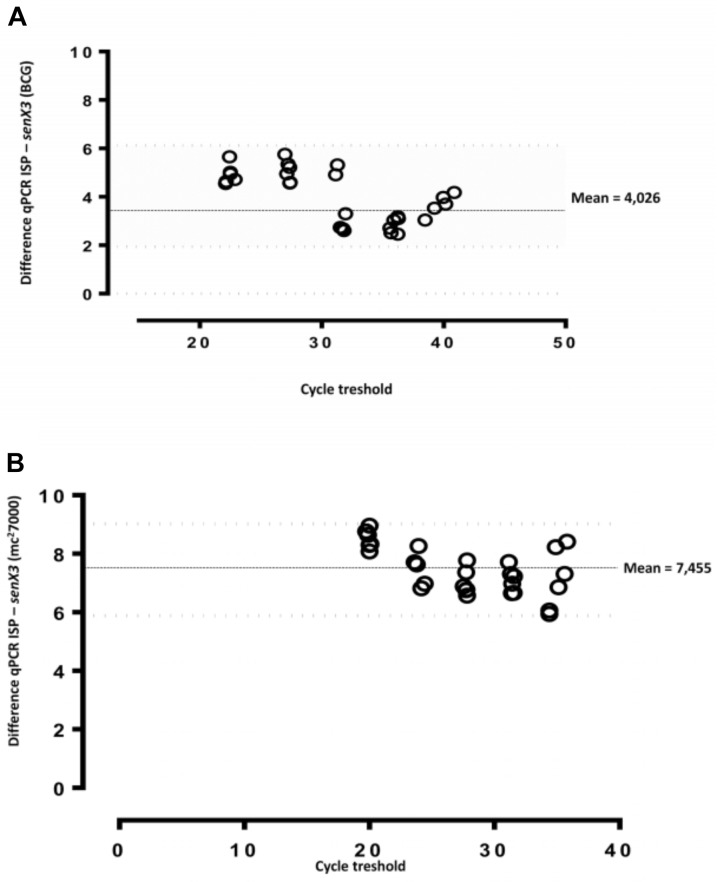
FIGURE 4.
Bland–Altman bias plots for two different quantitative MTBC DNA real-time PCR assays. Five serial dilutions of M. bovis BCG (A) and M. tuberculosis mc27000 (B) strain were tested for MTBC DNA quantification by IS6110 and senX3 PCR assays. The mean bias was determined to be 4.026 and 7.455-cycle threshold for M. bovis BCG and M. tuberculosis mc27000, respectively.

