Figure 4.

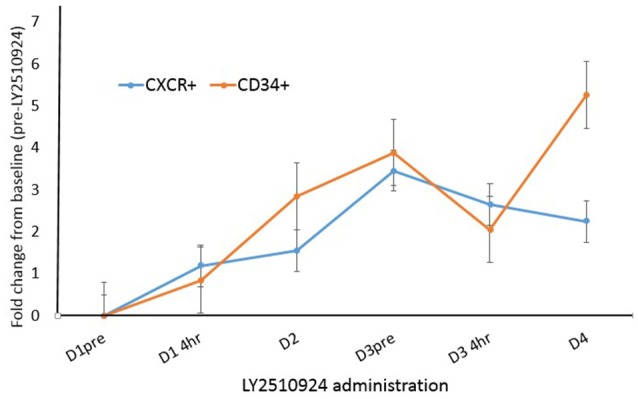
Fold change analysis plotted for CXCR4+ blasts and CD34+ cell populations over time, from day 1 to day 4. Mean fold changes from the baseline with standard errors are shown.

Fold change analysis plotted for CXCR4+ blasts and CD34+ cell populations over time, from day 1 to day 4. Mean fold changes from the baseline with standard errors are shown.