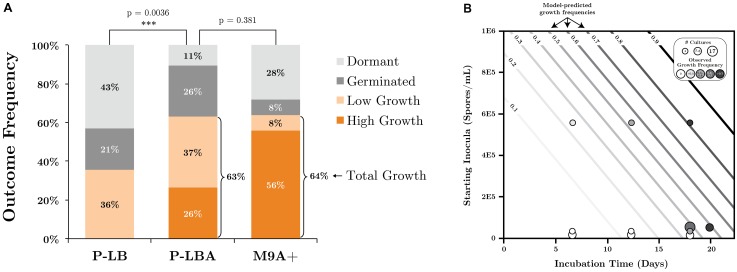
FIGURE 6.
(A) SR7 germination and growth frequencies under scCO2 in phosphate-buffered LB (P-LB), phosphate-buffered LB amended with L-alanine (P-LBA), and M9+ amended with L-alanine (M9A+) as measured by cell quantification for multiple individual experiments. High growth: ≥40-fold increase in cell counts relative to t0; low growth: >10-fold increase in cell counts relative to t0; germinated: <10-fold increase, mix of vegetative cells and spores; dormant: <10-fold increase, spores only. All cell-free control incubations (not plotted) resulted in no growth. (B) Logistic regression model of SR7 scCO2 growth outcome as a function of inocula concentration and incubation time, with predicted growth frequencies represented by contour lines (e.g., 0.5 = 50% likelihood of growth). Empirical data plotted on top of contours indicate the number of replicate cultures (symbol size) and frequency of growth (shading) for each end-point sampled scCO2 reactor. Growth outcomes demonstrate a statistically significant increase in the frequency of observed growth as a function of inocula spore density (p = 0.0057; Y-axis) and incubation time (p = 0.003; X-axis).

