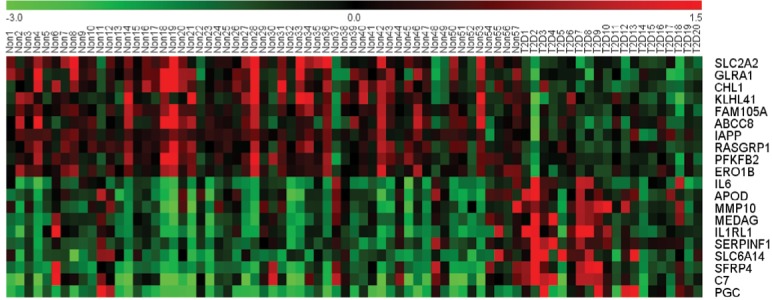
Figure 1.

A heat map of the top 10 upregulated DEGs and top 10 downregulated DEGs in 57 non-T2D islet samples and 20 T2D islet samples. Notes: Red: upregulation; green: downregulation.
Abbreviations: DEGs, differentially expressed genes; T2D, type 2 diabetes.
