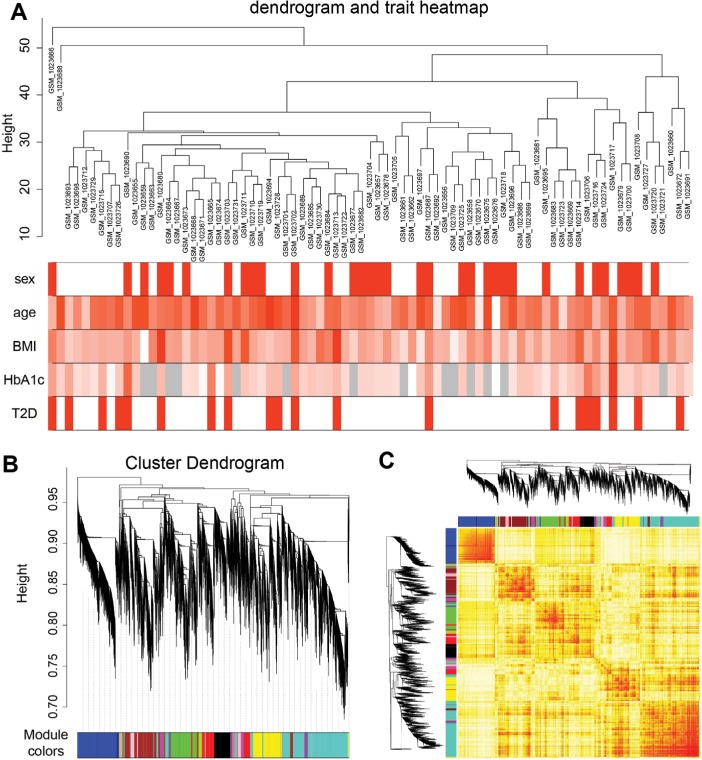
Figure 5.
Sample clustering and module detection.
Notes: (A) Sample dendrogram and trait indicator. The red color represents female and T2D samples, and the gray color represents no data in HbA1c. The color intensity was proportional to older age, higher BMI, and HbA1c levels. (B) Genes were clustered based on 1-TOM. Each colored branch indicates a module of highly connected genes. (C) The TOM plot shows the modules of gene expression by WGCNA.
Abbreviations: T2D, type 2 diabetes; TOM, topological overlap matrix; WGCNA, weighted correlation network analysis.

