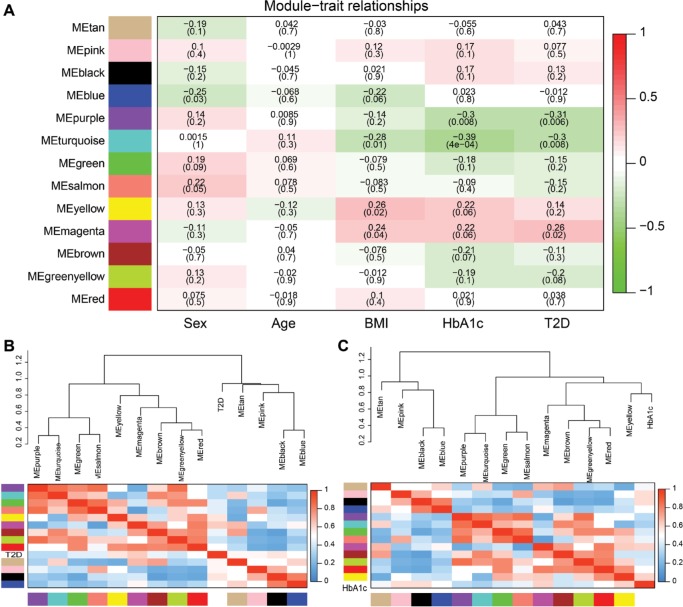
Figure 6.
Correlation between modules and T2D.
Notes: (A) Heatmap of the module–trait relationships. P-values between the detected modules on the y-axis and clinical traits on the x-axis are shown in the box. Color indicates the direction of association (red means positive correlation; green means negative correlation). Hierarchical clustering dendrograms and heatmap of the trait T2D (B) or trait HbA1c (C). Each row and column in the heatmap corresponds to one module (labeled by color) or the trait (labeled by T2D or HbA1c). Red represents positive correlation, and blue represents negative correlation.
Abbreviation: T2D, type 2 diabetes.

