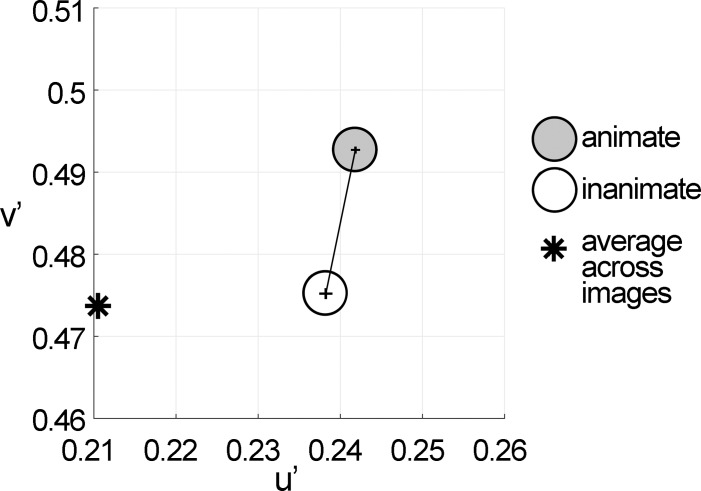
Figure 5.
Color statistics differed for animate and inanimate objects. Average chromaticity coordinates for pixels identified as part of animate or inanimate objects. Pixels were drawn from a tapestry of 10,000 randomly selected pixels from each category. This analysis was repeated 100 times (see Figure 2C). Pixels of animate objects were different from pixels of inanimate objects along the u′ dimension (p < 0.05 for 77/100 iterations), and along the v′ direction (p < 10−80 for all 100 iterations). Error bars are SEM.

