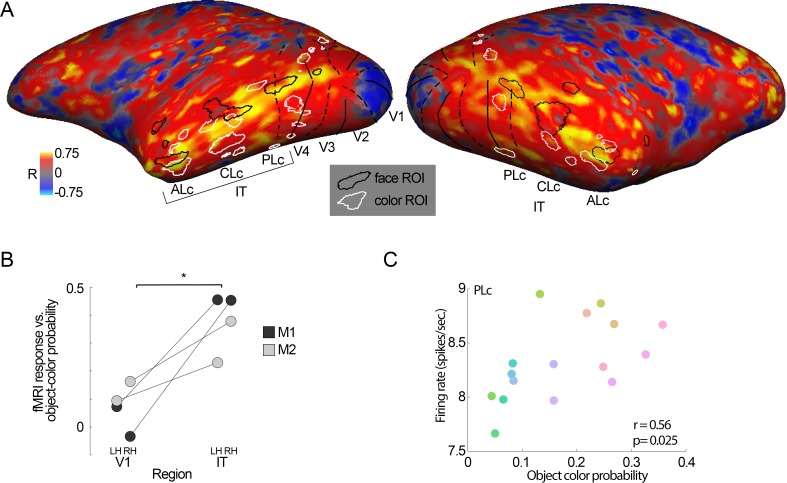
Figure 8.
Correlation of object-color statistics across the cerebral cortex. (A) Correlation coefficients between fMRI color tuning and object-color probabilities assessed for each voxel across both hemispheres for one monkey (M1). Color-biased regions are outlined in white; face patches are outlined in black. Vertical meridians are shown as broken lines; horizontal meridians are shown as solid lines. (B) Correlation coefficients were higher in IT compared to V1; the IT region of interest was defined by combining the color-biased regions and the face patches (paired t test across V1 and IT, p = 0.03; LH = left hemisphere; RH = right hemisphere). (C) The population of neurons recorded in fMRI-guided recordings of the posterior color-biased region showed a bias for colors more often associated with objects, consistent with the fMRI results (r = 0.56, p = 0.025). Data were obtained from 117 cells in 54 penetrations in M1.

