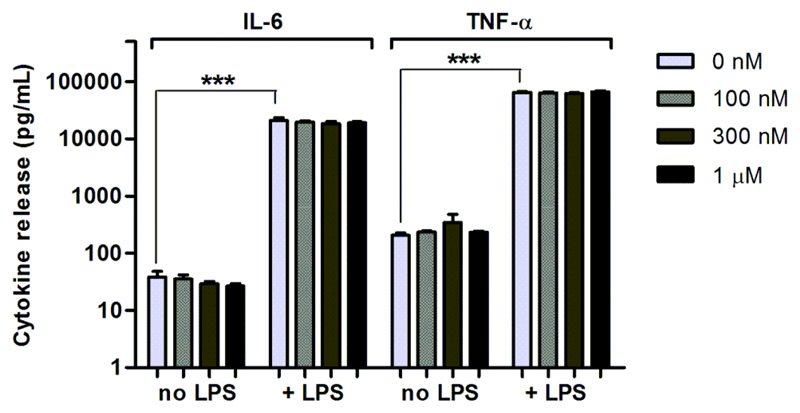
Figure 3. Cytokine release by macrophages after incubation with PhagoGreen.
RAW264.7 cells (with or without PhagoGreen) were stimulated with LPS (100 ng/mL) for 18 h. The levels of TNF-α and IL-6 in the supernatants were measured by ELISA. Values represented as means (n = 4) and error bars as SD, *** for p < 0.0001.

