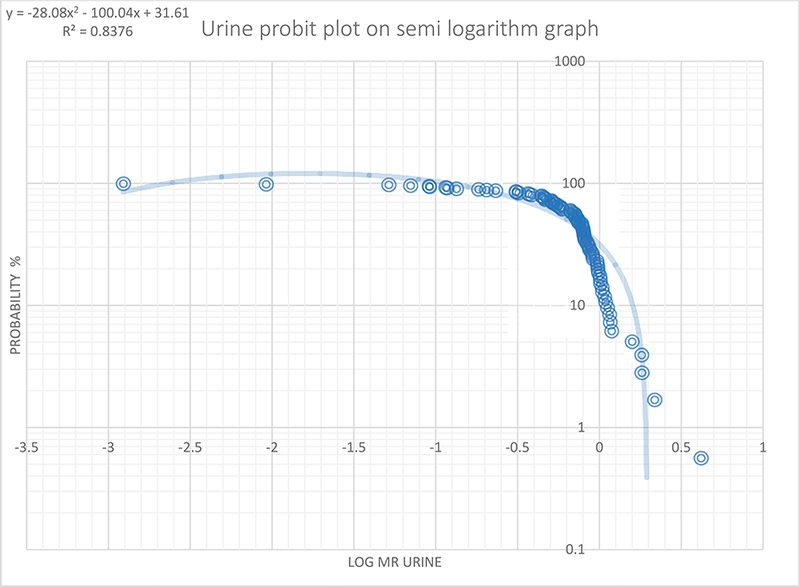
Figure 2:

Probit plot of metabolic ratio (n=89) in 8-hour urine samples
The probit plotted using the semi-log graph of probability percent (probability %) against the log MR and the trend line best fit plotted. The log MR (0.28) when the trend line crosses the x-axis was chosen as the anti-mode (1.91) by converting back to MR (i.e. the antilog of log MR) separating the poor metabolizers from the normal metabolizers.
