
Figure 1. G protein selectivity of dDA1 and DAMB.
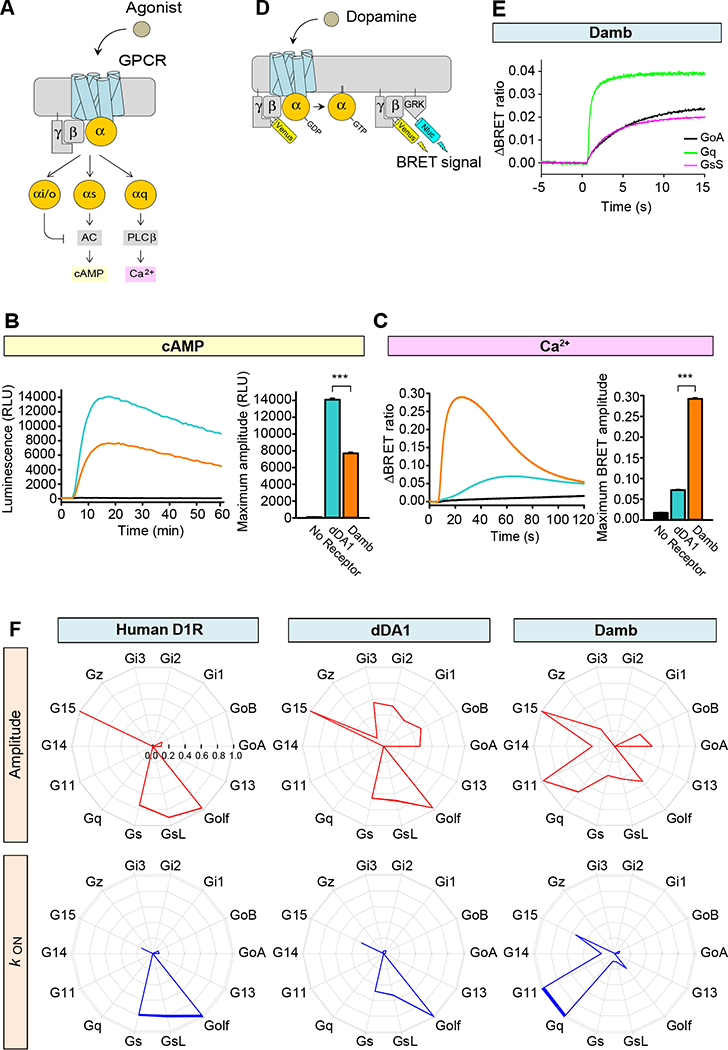
A. Cartoon of GPCR-mediated second messenger regulation. Stimulation with agonist leads to charging of the α subunit with GTP and its dissociation from βγ subunits. The Gαs subunit stimulates adenylyl cyclase (AC) resulting in cyclic AMP (cAMP) generation and Gαq stimulates phospholipase Cβ resulting in calcium release from internal stores.
B. Cyclic AMP assay to examine Gs coupling of the receptors. HEK293T/17 cells were transfected with GloSensor-22F/cAMP without exogenous GPCR (black) or with dDA1 (cyan) or DAMB (orange) expressing plasmids. A saturated concentration of DA (100 μM) was applied at 5 min and luminescence was monitored for 60 min. Each trace represents the mean of 6 replicates. The bar graph at the right quantitates the relative responses. Statistics: Results are expressed as the mean ± SEM. ANOVA with Tukey post hoc, ***p<0.001, n=6 per group.
C. Ca2+ assay to examine Gq coupling. HEK293T/17 cells were transfected with CalfluxVTN without exogenous GPCR or with dDA1 or DAMB expressing cDNAs. 100 μM DA was applied at 5 sec and the BRET ratio was monitored for 2 min. Each trace represents the mean of 6 replicates. The bar graph at the right quantitates the relative responses. Statistics: Results are expressed as the mean ± SEM. ANOVA with Tukey post hoc, ***p<0.001, n=6 per group.
D. Schematic representation of the BRET assay for real-time monitoring of G protein activity. Activation of a GPCR by agonist leads to the dissociation of inactive heterotrimeric G proteins into active GTP-bound Gα and Venus-Gβγ subunits. The released Venus-Gβγ can then interact with the Gβγ effector mimetic masGRK3ct-Nluc to produce the BRET signal. The masGRK3ct-Nluc reporter protein consists of C-terminal fragment of G protein Receptor Kinase, type 3 (GRK3) fused to a myristic acid attachment peptide (mas) and NanoLuc luciferase (Nluc) attached at the C-terminus (ct).
E. Real-time monitoring of G protein activation by the DAMB receptor. HEK293T/17 cells were transfected with the BRET sensor pair (panel D) and DAMB together with GαoA (black), Gαq (green), or GαsS (magenta). DA at 100 μM concentration was applied at time zero and the BRET signal followed across time. This time plot illustrates how the rate and magnitude of G protein coupling were assayed in panel F.
F. G protein selectivity diagrams of the human DA D1 receptor (D1R), dDA1, and DAMB. The maximum amplitudes (red) and activation rate constants (blue) from 14 different G proteins were normalized to the largest value and plotted in the wheel diagrams. Line thickness represents the SEM of six technical replicates performed in parallel. Two biological replicates using independent transfections were performed with similar results. Data are shown from one of the experiments.