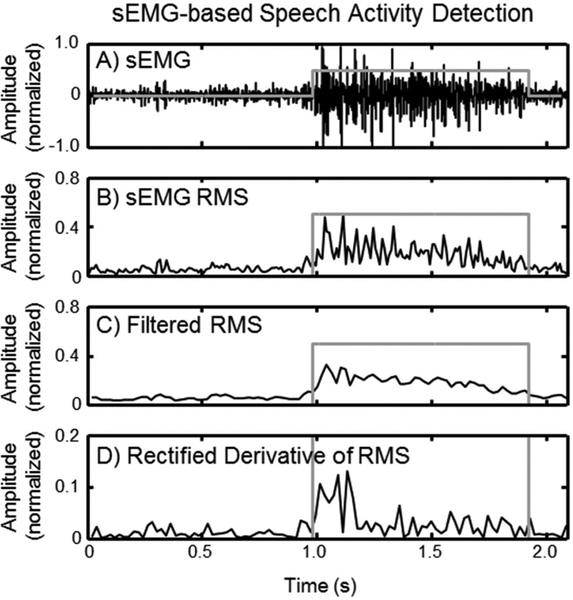
Figure 1.
An example of the sEMG-based speech activity detection operating on Channel 8 produced by Subject 4 saying the word ‘right’. The figure shows (A) the raw sEMG signal, (B) the sEMG RMS, (C) the filtered sEMG RMS using a 40 ms window with 20 ms overlap, and (D) the absolute value of the derivative of the filtered sEMG RMS, all marked in black. The gray step function in each subplot marks the region at which the algorithm detected speech activity.

