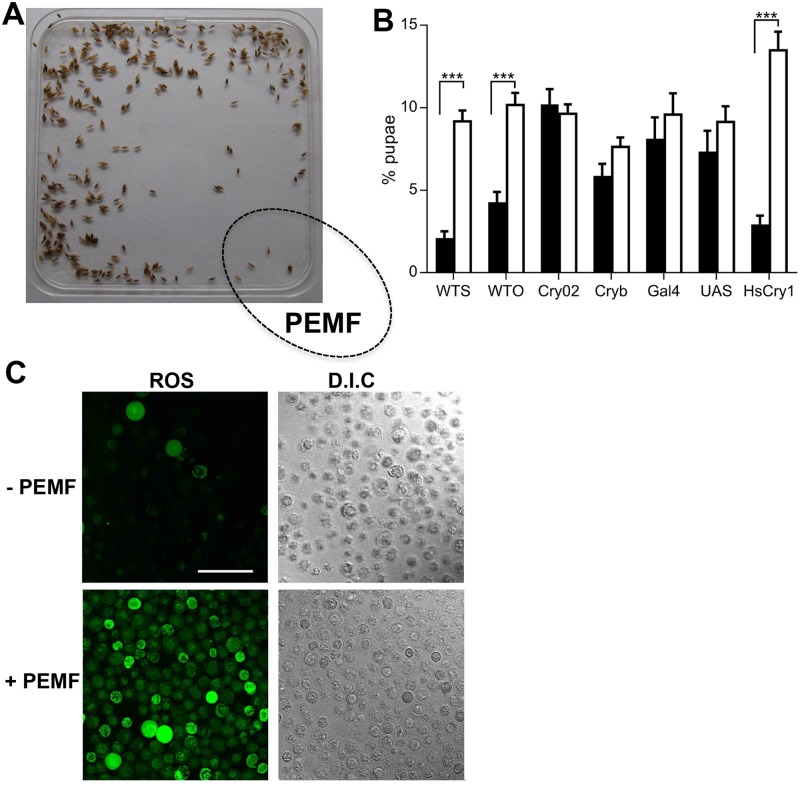
Fig 1. Insect behavioral and cellular response to PEMF.
(A). Distribution of wild-type Canton S larvae following 96-hour exposure in blue light (60 μmolm−2s−1) to PEMF (10 Hz) to the indicated corner. (B) Response to PEMF expressed as percentage of larvae in the petri plate corners: PEMF exposed corner (black bars), mean of 3 nonexposed corners (white bars). Data represent averages from 8 to 10 independent biological experiments (n = 8–10) (see S1 Data). Strains used are Canton S (WTS), Oregon (WTO), cry-deficient mutants (cry02 and cryb). Gal4 and UAS are nonexpressing parental strains for the cross (tim-gal4;cry02 × UAS-Hscry1;cry02) (HsCry1) that expresses the HsCry1 protein as described in ref. [27]. ***p < 0.001 (see Materials and methods for details of statistical treatment). Error bars are SEM. (C) SF21 insect cells overexpressing DmCry exposed to PEMF. Dark grown Sf21 insect cell cultures expressing high concentrations of DmCry as described [28] were illuminated for 15 minutes at 80 μmolm−2s−1 blue light in the presence (+) or absence (−) of PEMF and were viewed by confocal microscopy as described in Materials and methods. n = 5 biological repeats. Scale bar 100 μm. Data for Fig 1B is in S1 Data. DmCry, Drosophila cryptochrome; Gal4, tim-gal4;cry02; HsCry1, human cryptochrome-1; PEMF, pulsed electromagnetic field; Sf21,; UAS, UAS-Hscry1;cry02.

