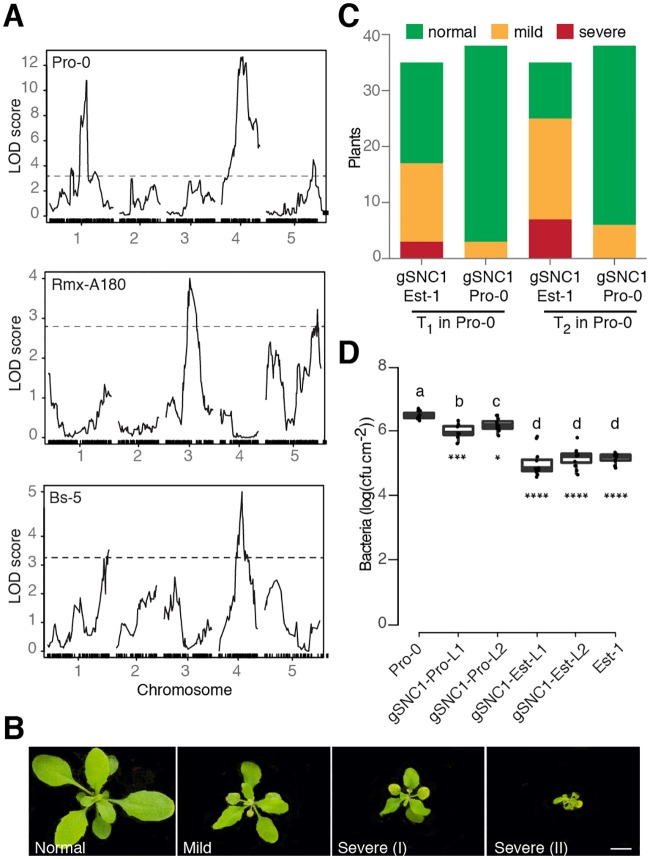
Fig 3. Genetic analysis of ACD6 modifiers in natural accessions.
(A) Necrosis QTL mapping in three F2 populations. Dashed lines indicate LOD score significance thresholds of p<0.05 (from 1,000 permutations). (B) Representative phenotypes of transformants expressing genomic SNC1 fragments. Scale bar, 10 mm. (C) Necrosis in transgenic Pro-0 plants. The effects of SNC1-Est-1 and SNC1-Pro-0 transgenes were significantly different (chi-square test, p<0.001). (D) Growth of Pst DC3000 after infection at OD600 = 0.0001. Bacterial growth in Pro-0 [gSNC1-Pro-0] was significantly different from either Pro-0 [gSNC1-Est-1] or nontransgenic Pro-0 on day 3. Asterisks indicate significance in pairwise Student’s t-tests against Pro-0 (*p<0.05, ***p<0.001, **** p<0.0001; Holm adjusted). Letters indicate significantly different groups (p<0.0001; post hoc Tukey’s HSD). L1/L2 designates two independent transgenic lines for both constructs.

