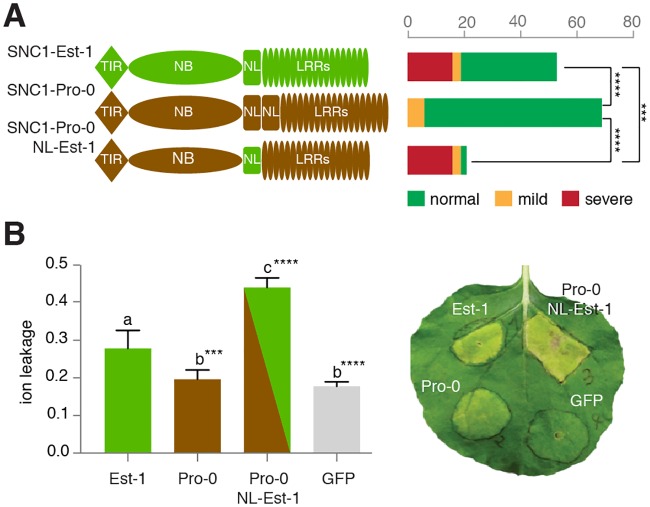
Fig 5. Contribution of NL linker variation to SNC1 activity.
(A) Distribution of necrosis in Col-0 T1 transformants expressing gSNC1-Pro-0 with different NL linkers. Asterisks indicate pairwise chi-square test results (***p<0.001, ****p<0.0001; Holm adjusted). (B) Left, ion leakage, an indicator of cell death, in N. benthamiana leaves transiently transformed with different gSNC1 transgenes 4 d after Agrobacterium infiltration. Asterisks indicate significance in pairwise Student’s t-tests against Est-1 (***p<0.001, ****p<0.0001; Holm adjusted). Letters indicate significantly different groups (p<0.0001; post hoc Tukey’s HSD). The leaf samples were collected from six independent plants. Right, image of a representative 7-day old leaf after infiltration.

