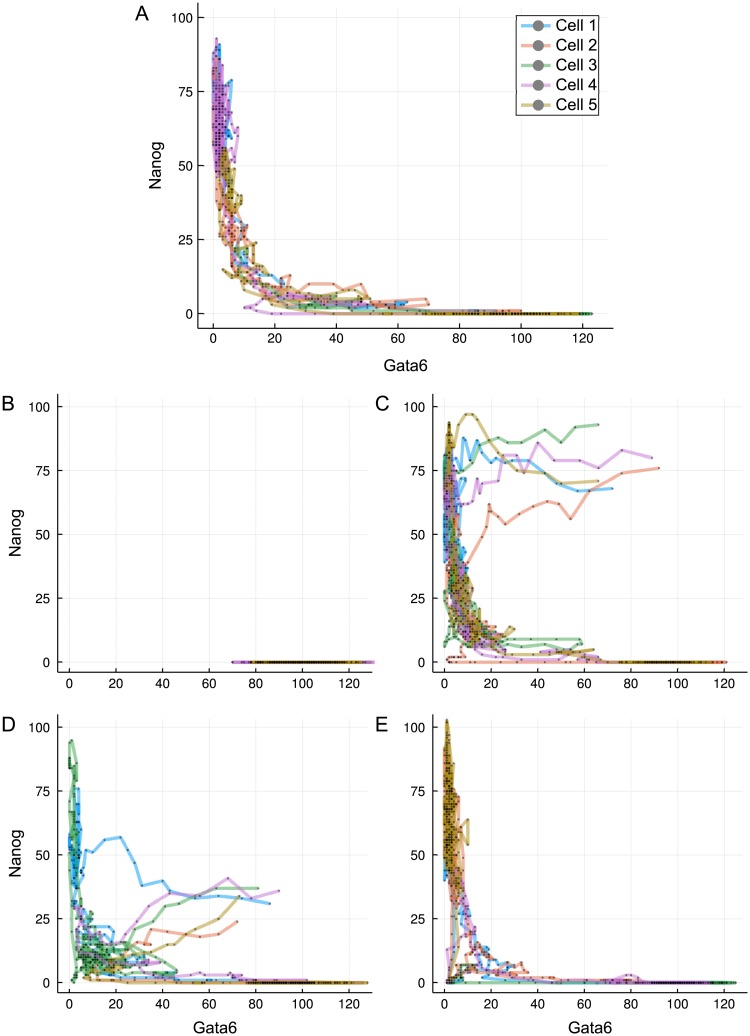
Fig 5. Transition paths during differentiation.
(A) Trajectories of five randomly selected stem cells after reduction in LIF concentration (L = 0), plotted on the Gata6-Nanog phase space. (B) Cells started from the differentiated state and put into L = 200. (C-D) Cells started from the unexplored region of high Gata6 and high Nanog (C) or low Nanog (D) levels for L = 0. (E) Trajectories started from the transition state under L = 50. Different line colours denote different cells, as indicated in the legend.

