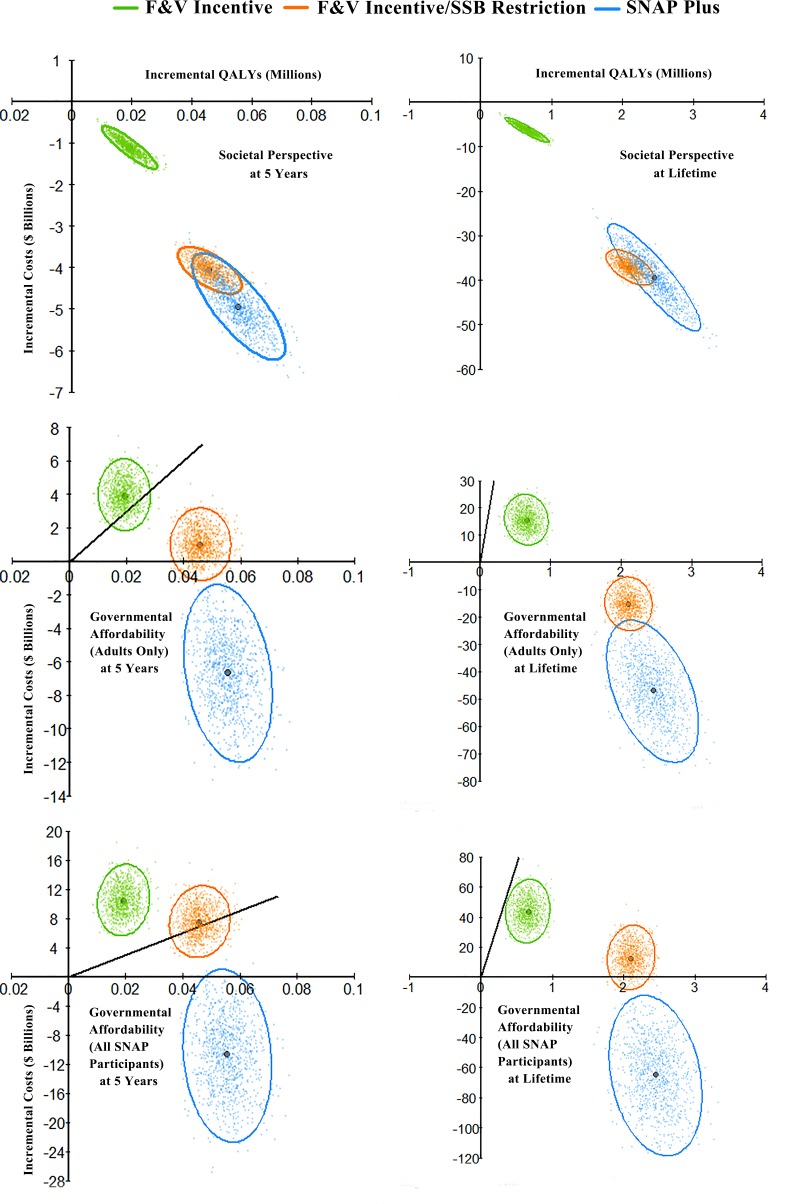
Fig 5. Probabilistic sensitivity analyses for cost-effectiveness of the SNAP F&V incentive, F&V incentive and SSB restriction, and a combined incentive/disincentive program for multiple foods (SNAP-plus), at 5 years and over a lifetime.
Values are presented in cost-effectiveness planes of incremental costs ($ billions) versus incremental quality-adjusted life years (QALYs), compared to a base scenario of usual care. For each scenario, each colored dot depicts 1 of 1,000 Monte Carlo iterations, with the large dot depicting the median incremental cost-effectiveness ratio (ICER, $/QALY); and the ellipse depicting the 95% UIs. Results are presented from the perspective of society (top panels), government affordability including food subsidy costs for SNAP adults only (middle panels), and government affordability including food subsidy costs for all SNAP participants (bottom panels). Negative costs represent cost savings. The diagonal solid black lines represent a value of $150,000/QALY, a recommended threshold for assessing health interventions, with values to the right of the line being cost-effective with an ICER<$150,000/QALY. Note: due to different minimum and maximum quantities among panel figures, different scales were applied to each figure. F&V, fruits and vegetables; HS, high school; ICER, incremental cost-effectiveness ratio; NH, non-Hispanic; QALY, quality-adjusted life year; SNAP, Supplemental Nutrition Assistance Program; SSB, sugar-sweetened beverage.

