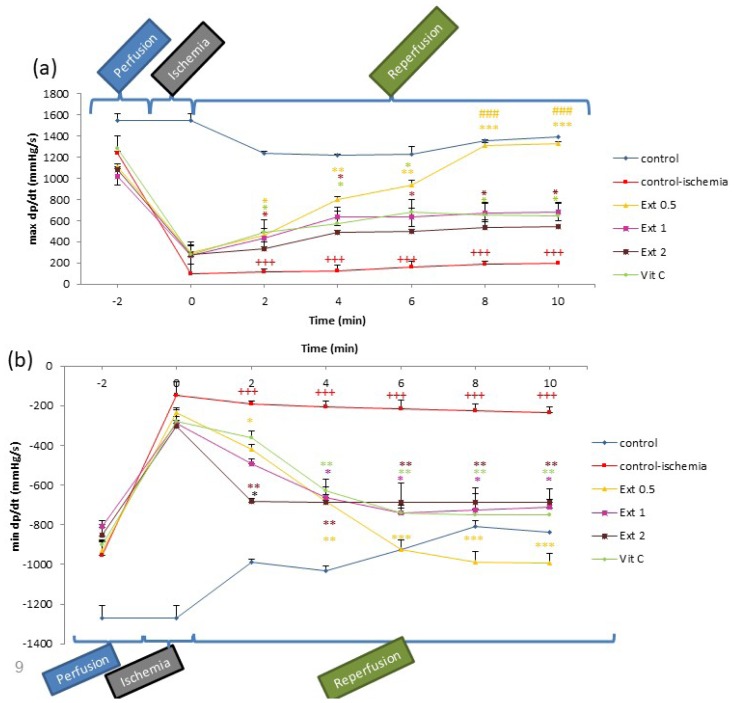
Figure 2.
Time course of change in the rate of ventricular pressure development (+dp/dt) and the rate of ventricular pressure decline (−dp/dt) in control, control ischemia, different concentrations of Teucrium polium extract (0.5, 1 and 2 mg/ml; Ext 0.5, Ext 1, Ext 2) and Vit C pretreated rat groups during ischemia-reperfusion. The data provided are mean ± SEM. +++p < 0.001 compared to control group. *p < 0.05, **p < 0.01, ***p < 0.001 compared to control ischemia group and ###p < 0.001 compared to Vit C group.

