
Figure 2.
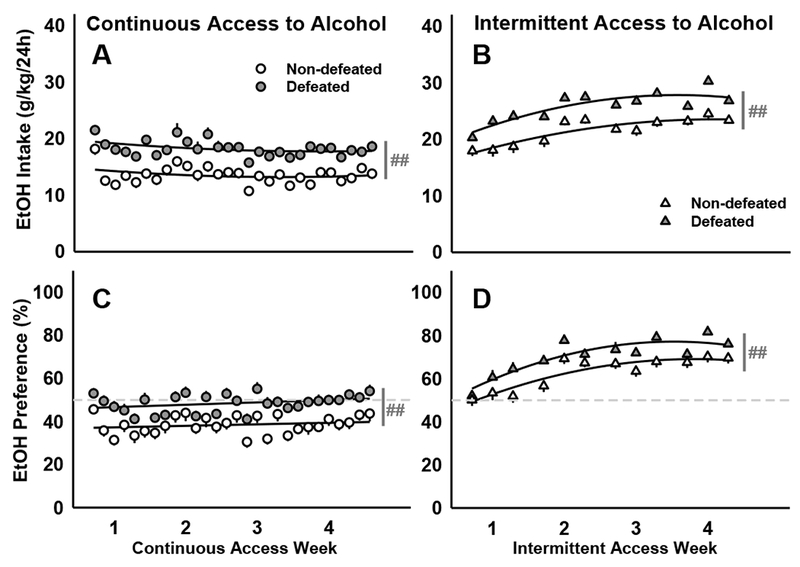
Socially defeated and non-defeated C57BL/6J males received 20% EtOH and water for four weeks prior to receiving weekly, systemic drug injections. Daily mean ± SEM intake (g/kg/24h) for mice with (A) continuous access to alcohol or (B) intermittent access to alcohol. The amount of alcohol consumed as a percentage of the total daily intake (EtOH Preference) is depicted as daily mean ±SEM for mice with (C) continuous or (D) intermittent access to alcohol. Best-fit curves are in black. Dark gray lines represent significant main effects: ##p<0.01 non-defeated vs. defeated. Dashed lines mark the preference cutoff: values >50% indicate a preference for alcohol over water while values <50% indicate a preference for water over alcohol.