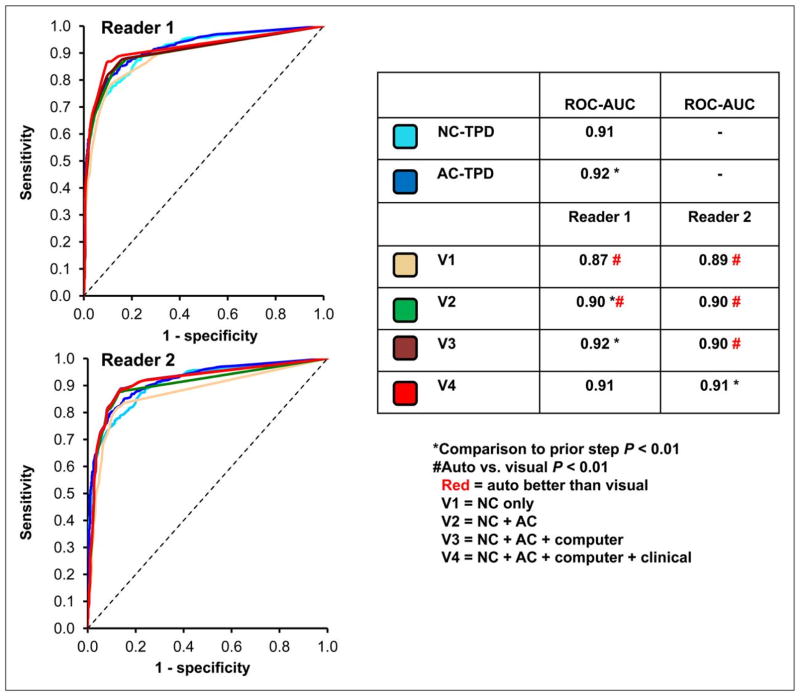
Figure 5. Diagnostic Performance of Automated versus Visual Interpretation.
Receiver operator characteristic curves comparing diagnostic performance between reads on per-patient basis (2 readers for detection of >70% diameter coronary stenosis). V, visual analysis; NC, non-attenuation corrected images; AC, attenuation corrected. Reproduced from research originally published in JNM. Arsanjani R, Xu Y, Hayes SW, Fish M, Lemley M, Jr., Gerlach J, et al. Comparison of fully automated computer analysis and visual scoring for detection of coronary artery disease from myocardial perfusion SPECT in a large population. J Nucl Med. 2013;54(2):221–8. © by the Society of Nuclear Medicine and Molecular Imaging, Inc. With permission.

