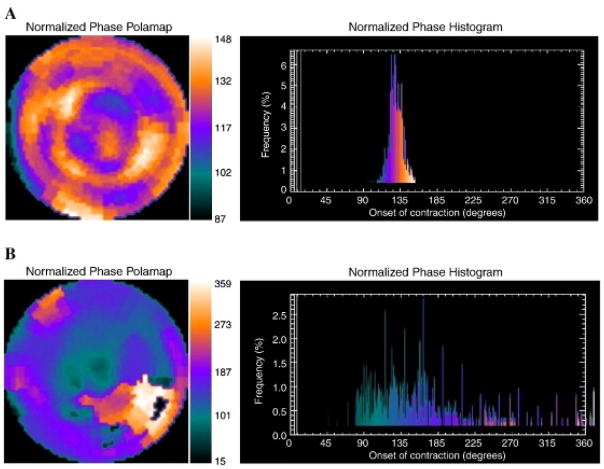
Figure 7. Representative Phase Histograms of Left Ventricular Mechanical Contraction.
A) Normal phase histogram: The X-axis represents the timing of one cardiac cycle (R-R interval) normalized in degrees. The Y-axis represents the percent of myocardium demonstrating the onset of mechanical contraction during any particular phase of the cardiac cycle. The color maps have 256 levels with the minimum level corresponding to black and the maximum level corresponding to white. B) Abnormal phase histogram showing a wide bandwidth indicating a delayed onset of myocardial contraction representing significant left ventricular mechanical dyssynchrony. Reproduced from Atchley AE, Kitzman DW, Whellan DJ, Iskandrian AE, Ellis SJ, Pagnanelli RA, et al. Myocardial perfusion, function, and dyssynchrony in patients with heart failure: baseline results from the single-photon emission computed tomography imaging ancillary study of the Heart Failure and A Controlled Trial Investigating Outcomes of Exercise TraiNing (HF-ACTION) Trial. Am Heart J. 2009;158(4 Suppl):S53–63. With permission.

