
Figure 14.
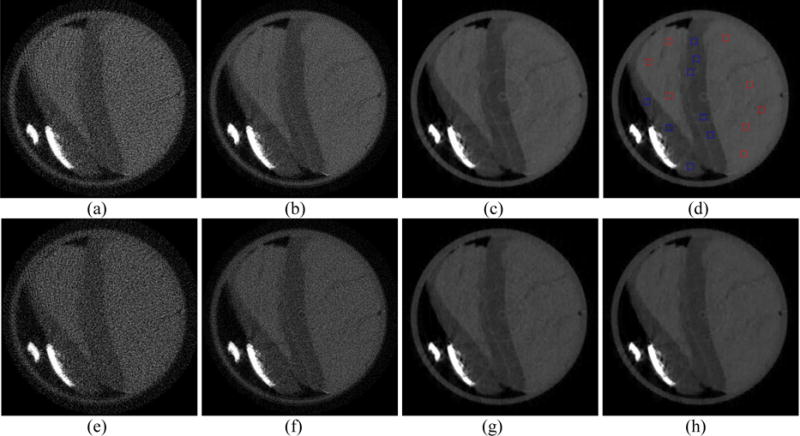
Spectral CT images at 20 keV (first row) and 25 keV (second row) energy bins. Figures (a) and (e) is the FBP results reconstructed from the 163-view projection. Figures (b) and (f) is the FBP results reconstructed from the full-view projection. Figures (c) and (g) is the RPCA results reconstructed from the 163-view projection. Figures (d) and (h) represent the results reconstructed by NLSMD method from the 163-view projection.