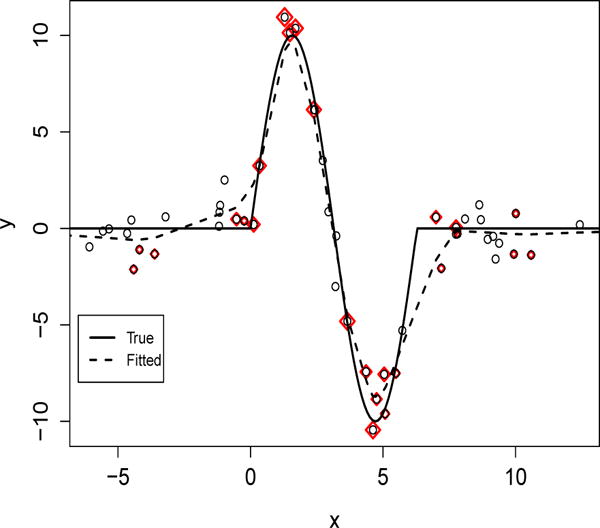
Figure 1.

Plot of the underlying f0 (solid) and fitted by DOSK (dashed) when n = 100 and p0 = 2. Observations with non-zero ’s are highlighted in red. One can see that the data sparsity penalty tends to choose observations that are closer to 0, π/2, 3π/2 and 2π for the function representation.
