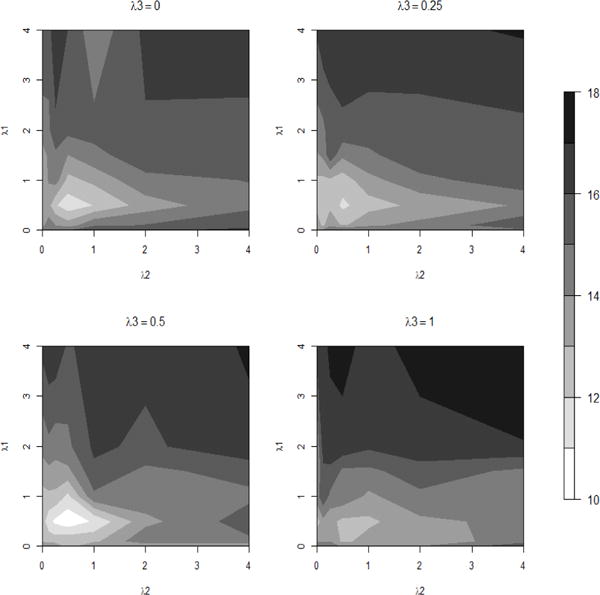
Figure 2.

Contour plots of the mean prediction errors of DOSK for Regression Example 2 where p0 = 8. Here λ3 is set as {0, 0.25, 0.5, 1} for the four panels and the kernel bandwidth , where is the median of the pairwise Euclidean distances of the simulated samples.
