Figure 2.
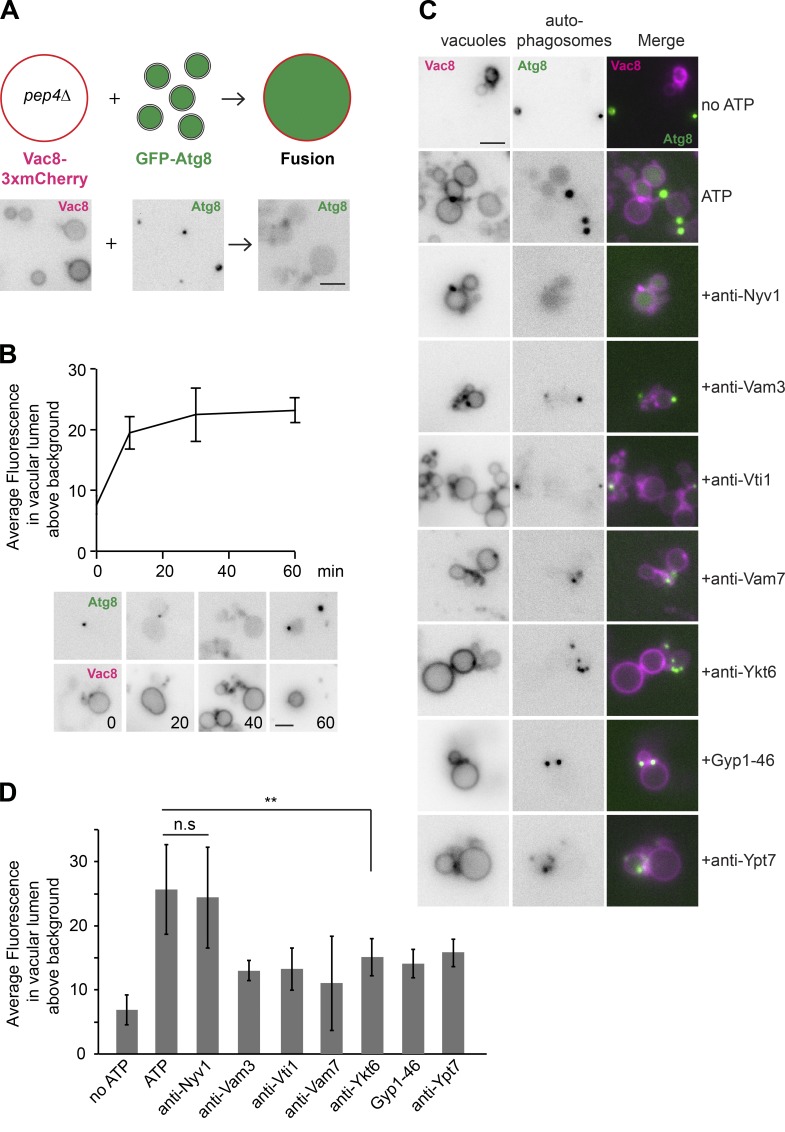
Establishment of in vitro autophagosome–vacuole fusion assay. (A) Scheme of the autophagosome–vacuole fusion (top). Autophagosomes were purified from vam3Δ cells expressing Atg9-3xFLAG, and GFP-Atg8 were starved for 3 h (bottom left). Vacuoles were isolated from pep4Δ cells expressing Vac8-3xmCherry (bottom middle), and then incubated with autophagosomes at 26°C for 1 h with ATP (bottom right). Fusion was analyzed by fluorescence microscopy. Scale bar, 2 µm. (B) Time course of autophagosome–vacuole fusion. Autophagosomes and vacuoles were purified as in A and incubated at 26°C with ATP for the indicated time. Fluorescence intensity of GFP-Atg8 in the vacuolar lumen was quantified by ImageJ using the region of interest manager tool. Separate channels for GFP-Atg8 and Vac8-3xmCherry are shown. Error bars represent standard deviations of three independent experiments. Scale bar, 2 µm. (C) Autophagosomes and vacuoles were purified as in A and incubated at 26°C for 1 h with or without ATP and with the indicated inhibitors. Analysis was performed as in B. (D) Quantification of the time course fusion experiments. Error bars represent standard deviations of three independent experiments. **, P < 0.01 (Student’s t test). All data are representative of at least three independent experiments.

