Figure 1.
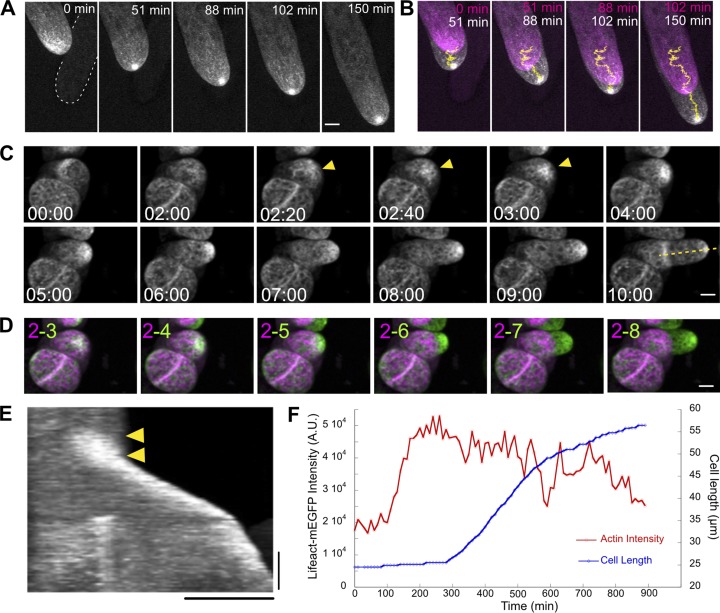
Apical actin cluster predicts the site of cell expansion. (A) A WT cell stably expressing Lifeact-mEGFP. Images are maximum projections of z-stacks acquired every 20 s. Bar, 5 µm. White dashed line outlines a cell in a different focal plane but in proximity to the imaged cell. (B) Images of two time points from the time-lapse acquisition shown in A were merged to show cell expansion. Magenta and white represent earlier and later time points, respectively. Yellow lines represent the trajectories of the actin cluster generated by TrackMate. (C) Actin in WT cells regenerated from protoplasts (See Materials and methods). Actin began to accumulate and increased in intensity (yellow arrowheads) a few hours before cell expansion was apparent. Images are maximum projections of z-stacks acquired every 10 min. Bar, 10 µm. Time stamps represent h:min. (D) Images of two time points from the time-lapse acquisition shown in C were merged to show cell expansion. Magenta and green represent earlier and later time points, respectively. Numbers indicate the time points selected (hours) for the merge. Bar, 10 µm. (E) Kymograph generated from the yellow dashed line in C. The actin signal started to increase (yellow arrowheads) before cell expansion occurred. Bars, 3 h (vertical) and 20 µm (horizontal). (F) From the cell shown in C, mean intensity of Lifeact-mEGFP signal near the cell apex and cell length was plotted against time A.U., arbitrary units. See also Videos 1 and 2 and Fig. S1.

