Figure 8.
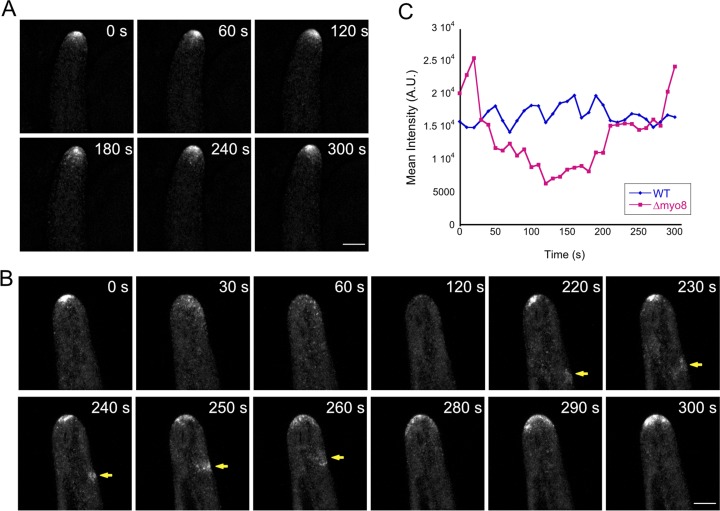
Loss of myosin VIII affects For2A distribution. (A) A WT cell expressing For2A-GFP. (B) A Δmyo8 cell expressing For2A-GFP. Yellow arrows point to waves of For2A-GFP moving from the back toward the tip of the cell. Images are maximum projections of z-stacks acquired every 10 s. Bars, 5 µm. (C) From time-lapse acquisitions shown in A and B, a 5-µm diameter circle near the cell tip was tracked using TrackMate, and the mean intensity of For2A-GFP signal was plotted over time. A.U., arbitrary units. See also Video 10, Fig. S5, and Fig. S6.

