Figure 9.
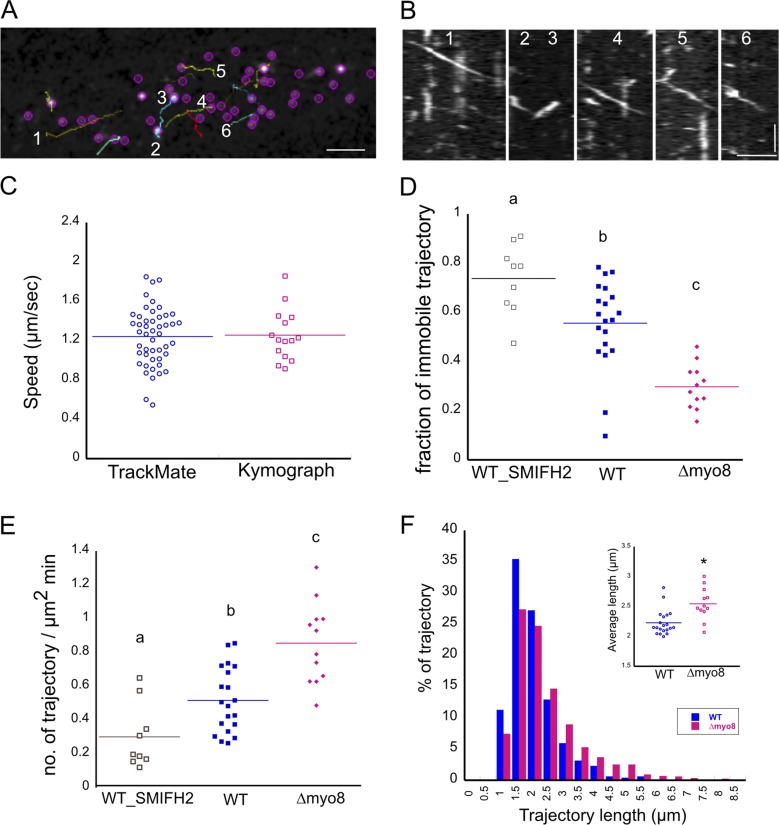
For2A activity is elevated in Δmyo8 cells. For2A-GFP particles were imaged in WT and Δmyo8 cells with VAEM. Particles were tracked with TrackMate. (A) A snap shot from the tracking results. Colored lines are trajectories identified by TrackMate. Bar, 2 µm. (B) Kymographs generated from colored lines in A. Bars, 2 µm (horizontal) and 2 s (vertical). (C) Particle speeds calculated from tracking results were compared with particle speeds measured from kymograph analysis. (D and E) Fraction of immobile For2A-GFP trajectories (D) and the number of linear trajectories per µm2 per minute (E) is plotted for WT cells, WT cells treated with 25 µM formin inhibitor SMIFH2, and Δmyo8 cells. Letters a, b, and c indicate statistical groups with α < 0.05 from an ANOVA analysis. (F) Histograms of trajectory length comparing WT and Δmyo8 cells. Data are cumulative from 20 WT cells and 12 Δmyo8 cells. Total trajectories: 960 (WT) and 876 (Δmyo8). Inset, average trajectory length from each cell. The asterisk (*) indicates statistical significance with α < 0.05 from an ANOVA analysis.

