Figure 4.

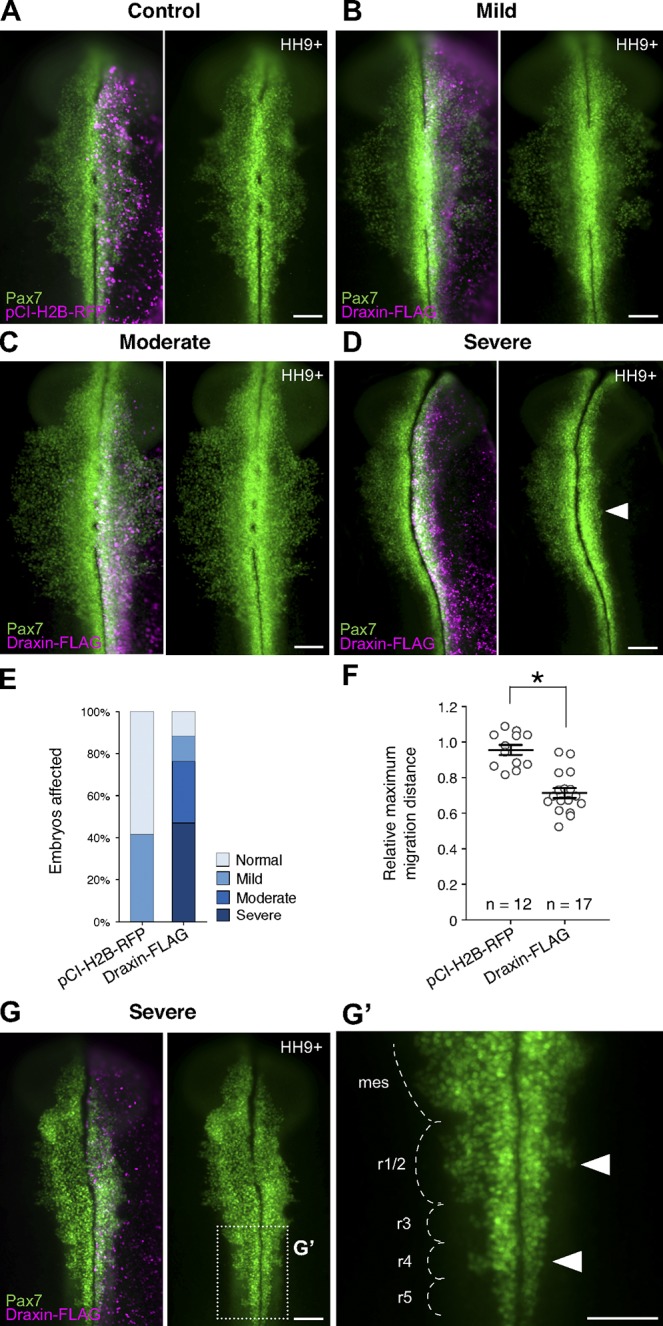
Draxin overexpression reduced cranial neural crest emigration from the neural tube. (A–D) Immunostaining against Pax7 (green) in pCI-H2B-RFP (A; control) or Draxin-FLAG–electroporated (B–D) embryos. H2B-RFP fluorescence (magenta) indicated successful electroporation for both constructs. (B–D) Representative images for mild (B), moderate (C), and severe (D) phenotypes of Pax7-immunostained (green) embryos unilaterally electroporated with Draxin-FLAG. Arrowhead in D highlights defects in neural crest emigration resulting from perturbation. (E) Quantification of phenotype penetrance for embryos unilaterally electroporated for pCI-H2B-RFP (control) or Draxin-FLAG. Data are presented as fraction of the total number of pCI-H2B-RFP– and Draxin-FLAG–electroporated embryos (n = 12 and n = 17, respectively; pooled from more than three independent experiments). Relative maximum migration distance data are represented in this figure as “normal” (within SEM of pCI-H2B-RFP average), “mild” (between minimum limit of SEM of pCI-H2B-RFP average and maximum limit of SEM of Draxin-FLAG average), “moderate” (within SEM of Draxin-FLAG average), and “severe” (less than the minimum limit of SEM of Draxin-FLAG average). (F) Quantification of relative maximum migration distance indicated that Draxin-FLAG overexpression significantly reduced the emigration of Pax7+ neural crest cells from the neural tube compared with pCI-H2B-RFP control (A). Each circle represents the average of six measurements per embryo taken over a 300-µm anterior-to-posterior region of cranial neural crest. *, P < 0.0001, two-tailed t test. Black bars, mean ± SEM. (G) Closer examination of the hindbrain region of a Draxin-FLAG overexpression embryo with a severe phenotype revealed a similar inhibition of neural crest emigration at rhombomeres 1/2 and 4 (arrowheads). Box in G indicates zoomed area in G’. Mes, mesencephalon; r, rhombomere. Bars, 100 µm.
