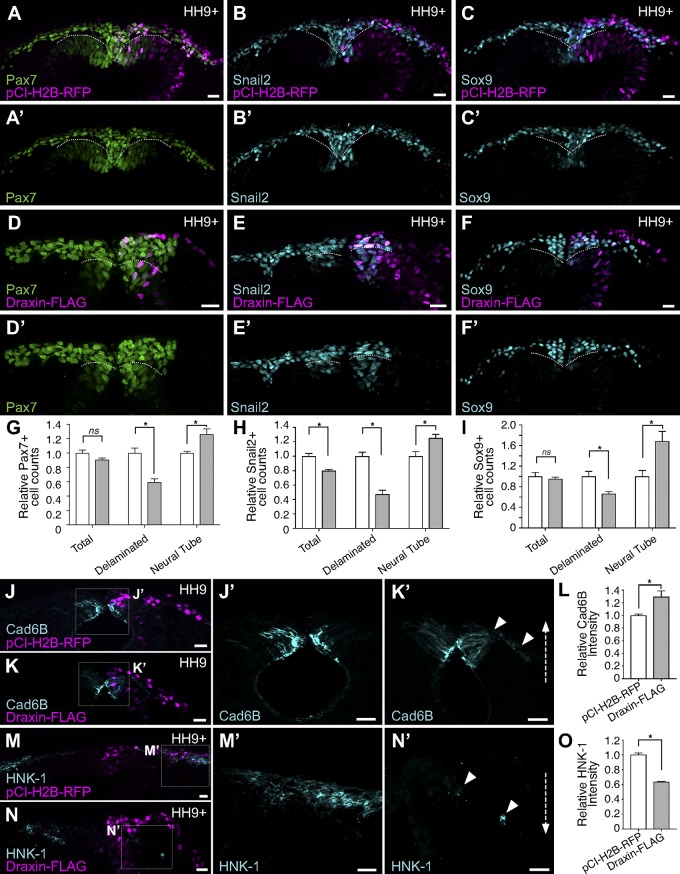
Figure 5.
Draxin overexpression altered expression of markers of neural crest EMT. (A–F) Cross sections of pCI-H2B-RFP (A–C; control) or Draxin-FLAG–electroporated (D–F) embryos (magenta) immunostained for Pax7 (A and D), Snail2 (B and E), and Sox9 (C and F). To visually compare the number of Pax7+, Snail2+, and Sox9+ neural crest cells undergoing delamination, the extreme dorsal aspect of the neural tube epithelium is indicated by a dotted line. (G–I) Quantification of Pax7+ (G), Snail2+ (H), and Sox9+ (I) cells on electroporated versus unelectroporated sides of embryo (three sections/embryo; n = 3 embryos/condition). Draxin-FLAG overexpression yielded no significant difference in the total numbers of Pax7+ and Sox9+ cells (P = 0.13 and P = 0.6, respectively; two-tailed t test) between pCI-H2B-RFP (A and C) or Draxin-FLAG–electroporated (D and F) embryos, although a significant decrease in Pax7+ and Sox9+ cells that delaminated and left the dorsal neural tube (*, P = 0.009 and P = 0.03, respectively; two-tailed t test) and a significant increase in Pax7+ cells that were retained within the dorsal neural tube (NT; *, P = 0.03 and P = 0.04, respectively; two-tailed t test) were observed with Draxin-FLAG overexpression. Draxin-FLAG overexpression yielded significant decreases in both the total and delaminated numbers of Snail2+ cells (*, P = 0.008 and P = 0.002, respectively; two-tailed t test) and a significant increase in the number of NT Snail2+ cells (*, P = 0.03; two-tailed t test). (J–O) Representative cross sections of embryos electroporated with pCI-H2B-RFP (J and M) or Draxin-FLAG (K and N) immunostained for Cad6B (J and K) and HNK-1 (M and N) at HH9/9+. Boxes in J–N indicate zoomed areas in J’–N’. Arrowheads indicate ROIs for comparison. Quantitation of the relative fluorescence intensity for Cad6B (L) and HNK-1 (O) found significant increase in fluorescence intensity for Cad6B with Draxin-FLAG overexpression (*, P = 0.04; two-tailed t test) and a significant reduction in fluorescence intensity for HNK-1 with Draxin-FLAG overexpression (*, P = 0.02; two-tailed t test). Bars, 20 µm. Dotted arrows in K′ and N′ illustrate changes in fluorescence intensity compared with control. Data are presented as mean ± SEM.

