Figure 7.

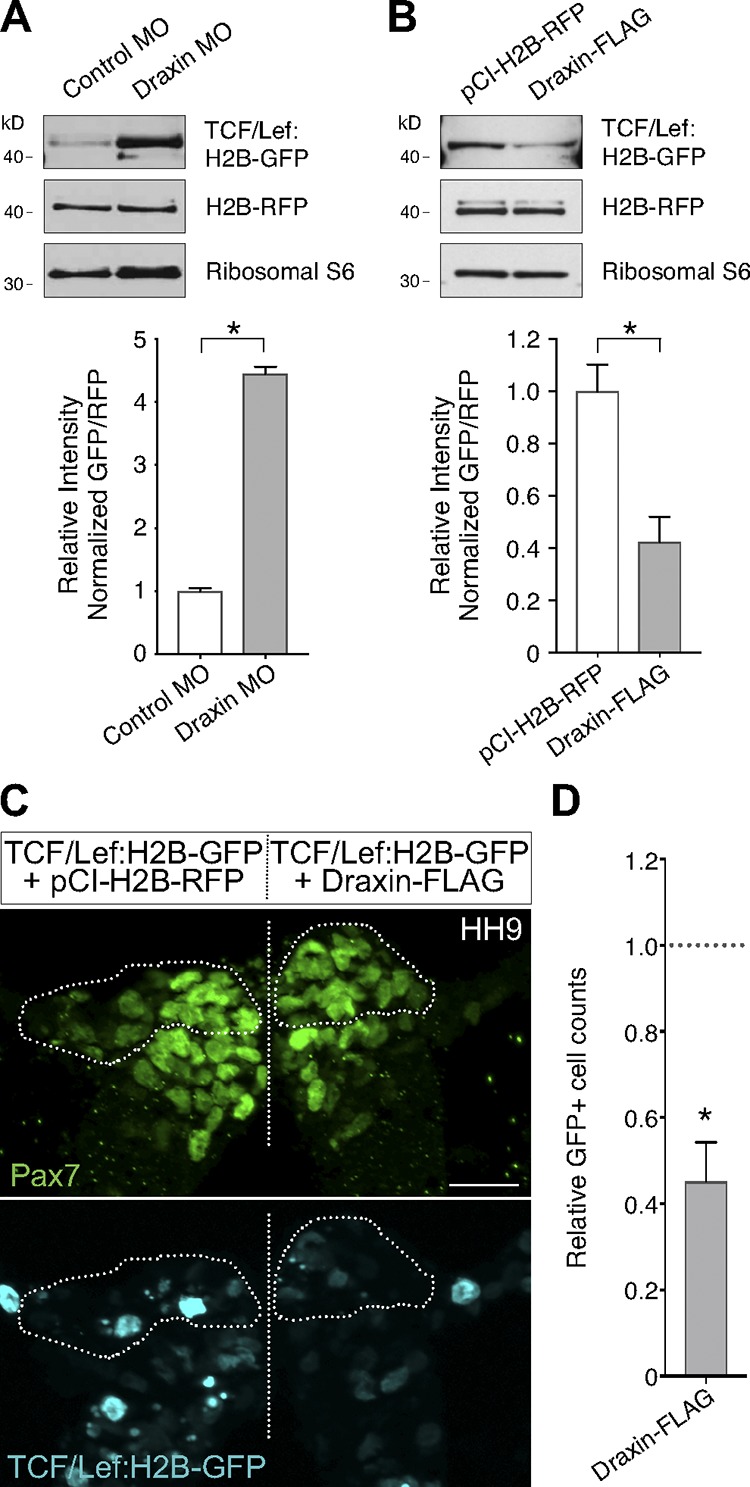
Draxin perturbation altered canonical Wnt reporter expression in vivo. (A) Quantitative Western blots compared normalized levels of GFP relative to RFP between control MO and Draxin MO–electroporated sides of the same embryos, each coelectroporated with a TCF/Lef:H2B-GFP canonical Wnt reporter construct and grown to HH9. Quantification revealed a significant increase in GFP expression when Draxin was knocked down (*, P < 0.0001; two-tailed t test; n = 12 pooled half embryos). (B) Quantitative Western blots compared normalized levels of GFP relative to RFP between pCI-H2B-RFP and Draxin-FLAG–electroporated sides of the same embryos, each coelectroporated with a TCF/Lef:H2B-GFP canonical Wnt reporter construct and grown to HH9. Quantification revealed a significant reduction in GFP expression when Draxin-FLAG was overexpressed (*, P = 0.015; two-tailed t test; n = 15 pooled half embryos). (C) Representative cross section of embryo coelectroporated with TCF/Lef:H2B-GFP (cyan) and pCI-H2B-RFP (left) or Draxin-FLAG (right) immunostained for Pax7 (green). To visually compare TCF/Lef:H2B-GFP reporter expression levels in neural crest cells undergoing EMT, Pax7+ cells that have delaminated from the neural tube are circled. Straight dotted line indicates the midline. Bar, 20 µm. (D) Quantitation of GFP+ cells on pCI-H2B-RFP (left) versus Draxin-FLAG (right) sides of embryo (three sections/embryo; n = 3 embryos/condition) yielded a significant decrease (*, P = 0.02; two-tailed t test) in total GFP+ cells on the Draxin-FLAG–electroporated side compared with the control side. Data are presented as mean ± SEM.
