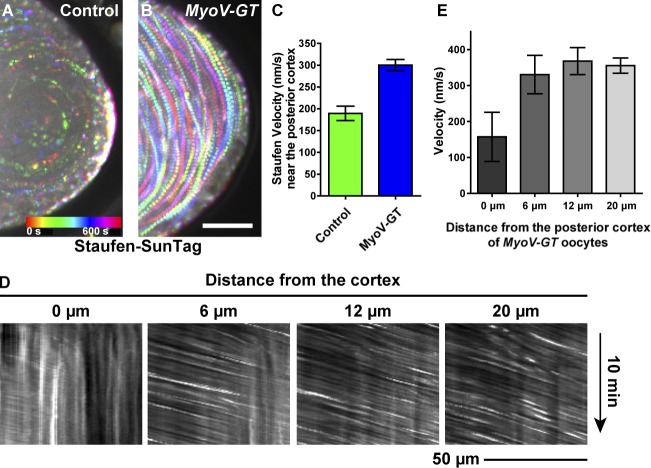
Figure 5.
MyoV functions to anchor Staufen at the posterior cortex of streaming oocytes. (A and B) Temporal color-coded images showing Staufen-SunTag movement near the posterior cortex in a control oocyte (A) and a MyoV-GT mutant oocyte (B). Bar, 25 µm. (C) Quantification of Staufen-SunTag velocities near the posterior cortex in MyoV-GT mutant and control oocytes (the same set of data as Fig. 1 C). Unpaired t test with Welch's correction between control posterior cortex and MyoV-GT posterior cortex. P < 0.0001. (D) Kymographs of Staufen-SunTag particles at different distances from the posterior cortex of the MyoV-GT mutant oocyte (B). (E) Average velocities (mean ± 95% confidence intervals) of Staufen-SunTag particles at different distances from the posterior cortex of the MyoV-GT oocyte.

