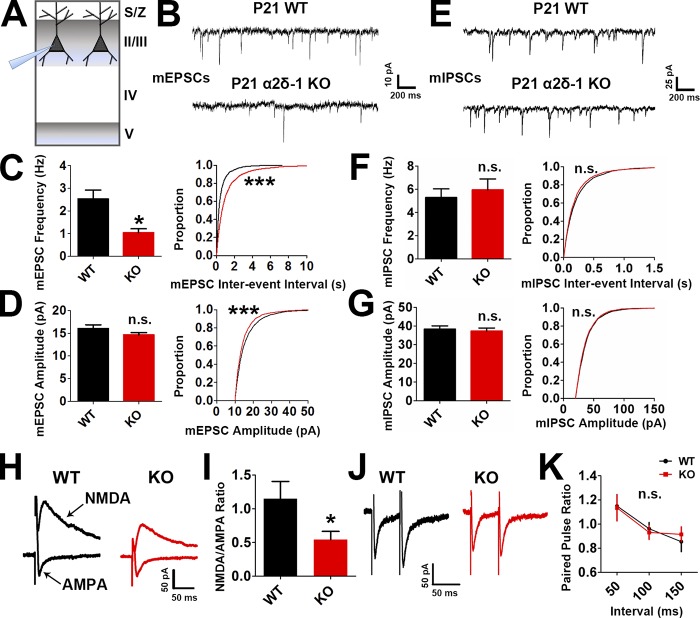
Figure 2.
Lack of α2δ-1 results in decreased excitatory synaptic function. (A) Recordings were made from LII/III pyramidal neurons in V1 at P21. (B) mEPSC traces from WT and α2δ-1 KO pyramidal neurons. (C and D) Frequency (C, left), interevent interval (C, right), and amplitude (D) of mEPSCs from WT and α2δ-1 KO neurons (n = total of 12 cells from three animals/genotype). Left: Two-tailed t test. Right: Kolmogorov–Smirnov test. (E) mIPSC traces from WT and α2δ-1 KO pyramidal neurons. (F and G) Frequency (F, left), interevent interval (F, right), and amplitude (G) of mIPSCs from WT and α2δ-1 KO neurons (n = total of 10 cells from three animals/genotype). Left: Two-tailed t test. Right: Kolmogorov–Smirnov test. (H) Traces of NMDA-only and AMPA-only evoked currents from WT and α2δ-1 KO pyramidal neurons. (I) Quantification of NMDA/AMPA ratio between WT and α2δ-1 KO (n = total of 12 cells from three to four animals/genotype). Two-tailed t test. Error bars represent SEM. (J) Traces from paired pulse recordings from WT and α2δ-1 KO neurons. (K) Comparison of PPR between WT and α2δ-1 KO (n = total of 12 cells from three to four animals/genotype). One-way ANCOVA. Error bars represent SEM. *, P < 0.05; ***, P < 0.0001.

