Figure 1.
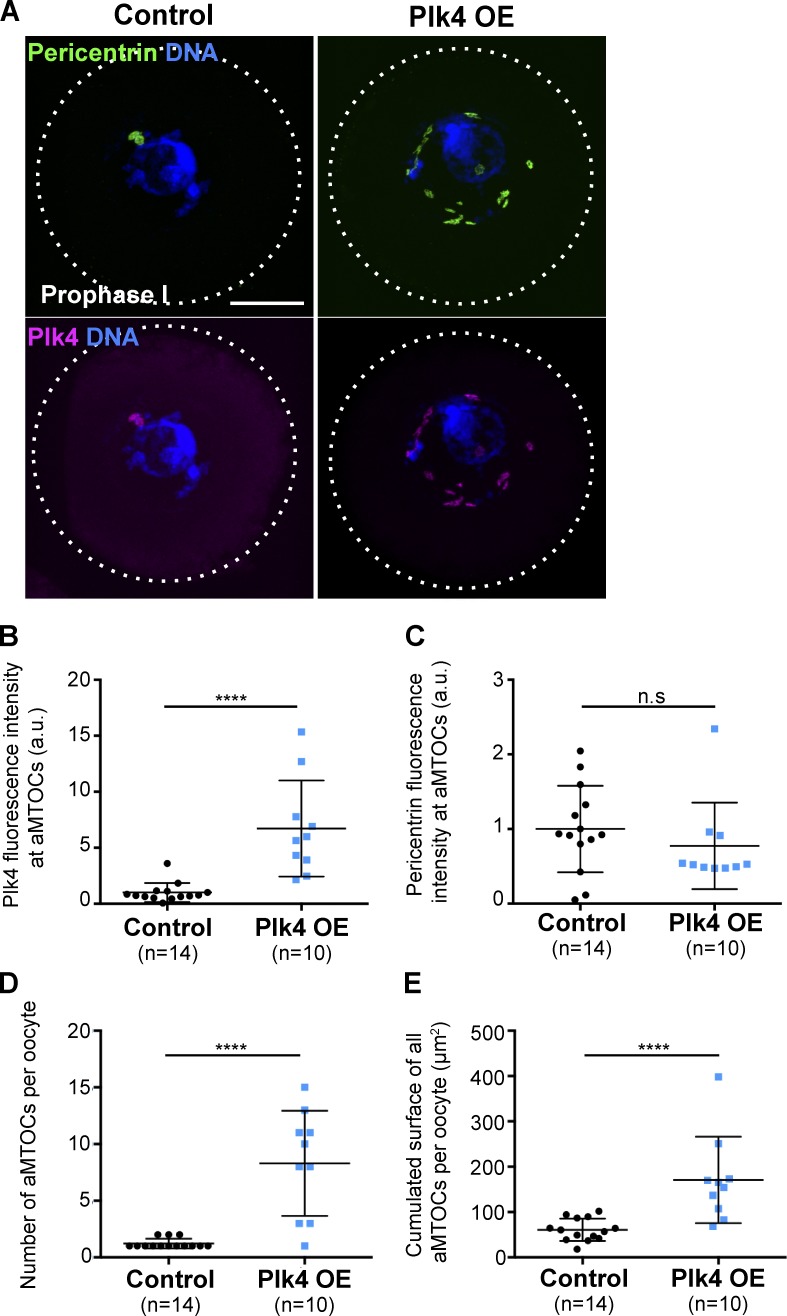
Plk4 OE induces aMTOC precocious fragmentation. (A) Immunofluorescent costaining of Plk4 (pink) and pericentrin (green) in control (left) and Plk4 OE (right) oocytes observed in prophase I. Scale bar is 10 µm. (B) Measure of Plk4 fluorescence intensity exclusively at nucleus associated aMTOCs from control (black dots) and Plk4 OE oocytes (blue squares) as observed in A; arbitrary units; ****, P < 0.0001. (C) Measure of pericentrin fluorescence intensity exclusively at nucleus associated aMTOCs from control (black dots) and Plk4 OE (blue squares) oocytes as observed in A; arbitrary units, P = 0.2125. (D and E) 3D quantitative analysis of aMTOCs number per oocyte (D) and their cumulated external surface per oocyte (E) in control (black dots) and Plk4 OE (blue squares) oocytes in prophase I as observed in A. ****, P < 0.0001 for number and surfaces. In B–E, statistical tests used are two-tailed Mann–Whitney, and n corresponds to the number of oocytes. Error bars correspond to SD.

