
Figure 4. FtsZ and GpsB reciprocally influence each other’s subcellular localization pattern.
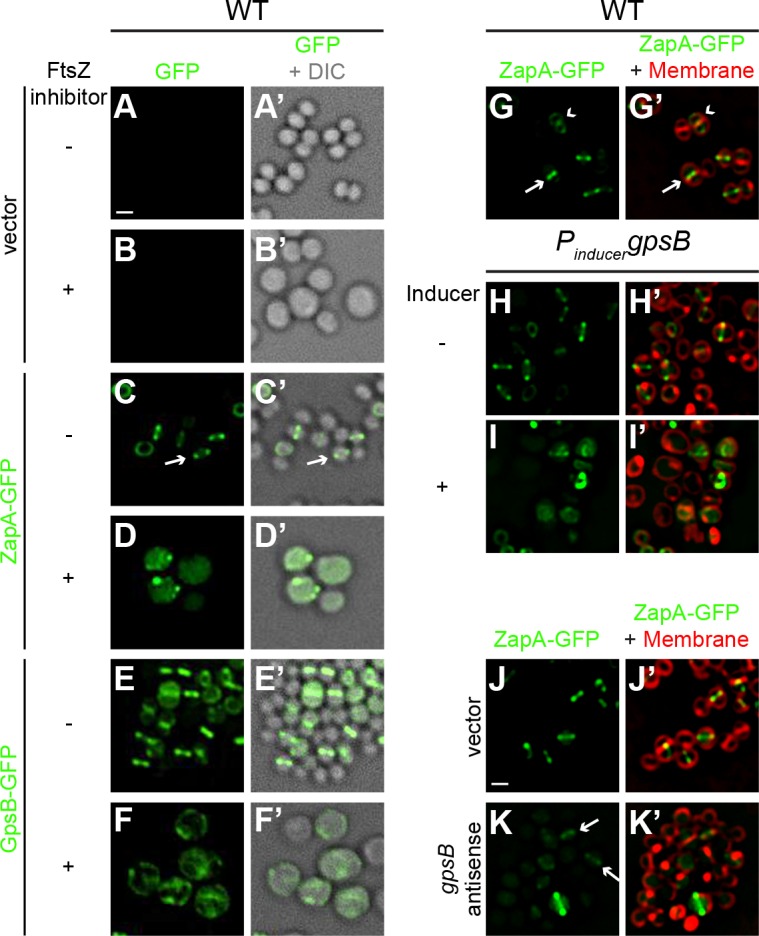
Morphology of wild type S. aureus cells harboring empty vector (strain SH1000 pCL15) in the absence (A–A’) or presence (B–B’) of FtsZ inhibitor PC190723 as visualized in the GFP fluorescence channel (A–B) or by differential interference contrast (DIC; A’–B’). Localization of ZapA-GFP (proxy for FtsZ localization; strain SH1000 pRB42; C–D’) or GpsB-GFP (E-F’; SH1000 pPE46) in the absence (C-C'; E-E') or presence (D-D'; F-F') of S. aureus FtsZ GTPase activity inhibitor PC190723. (G–I’) Localization of ZapA-GFP in wild type (G-G’; SH1000 pRB42), or in cells harboring an IPTG-inducible copy of gpsB in the absence (H-H’; SH1000 pPE45 pRB42) or presence (I–I’) of IPTG. Localization of ZapA-GFP in cells harboring vector only (J-J’; SH1000 pRB42 pEPSA5) or vector producing gpsB antisense RNA (K-K’; SH1000 pRB42 pGG59). A-K: GFP fluorescence; A’-F’: overlay of GFP fluorescence and DIC; G’-K’: overlay of GFP fluorescence and membrane. Arrows indicate site of cell division; arrowheads indicate ZapA-GFP localization at the subsequent plane of cell division. Scale bar: 1 μm.