
Figure 5. GpsB stimulates GTPase activity of FtsZ in vitro.
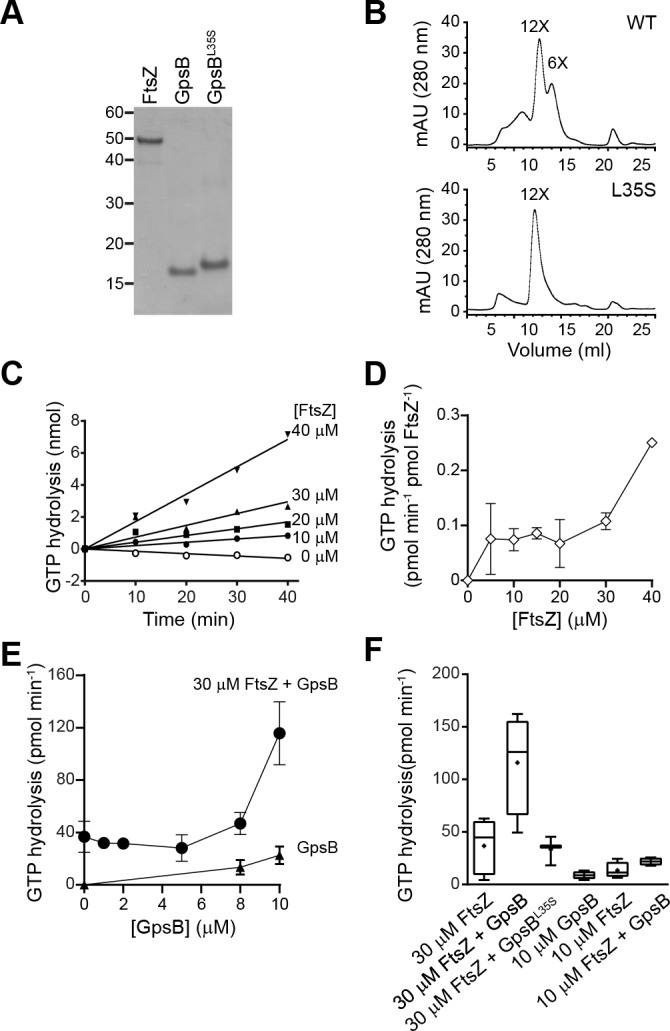
(A) Coomassie-stained gel of purified FtsZ, GpsB, and GpsBL35S. (B) Size exclusion chromatograms of purified GpsB (top) or GpsBL35S (bottom). Predicted multimerization states of the purified protein, based on migration of MW standards, is indicated above peaks (12X, dodecamer; 6X, hexamer). Shown is a representative example of at least 3 independent purifications. (C) Initial velocities of GTP hydrolysis by FtsZ as a function of time at various FtsZ concentrations. (D) GTP hydrolysis turnover rate of FtsZ as a function of FtsZ concentration. (E) GTP hydrolysis of increasing concentrations of GpsB alone (▲) or 30 μM FtsZ in the presence of increasing GpsB concentrations (●). Error bars represent SEM (n = 3). (F) Median GTP hydrolysis rates of 30 μM FtsZ and 10 µM FtsZ in the absence and presence of 10 μM GpsB or GpsBL35S. The ends of the boxes represent the first and third quartile of measurements; bars represent the entire range of measurements; line indicates median value; ‘+' indicates mean value (n = 3).