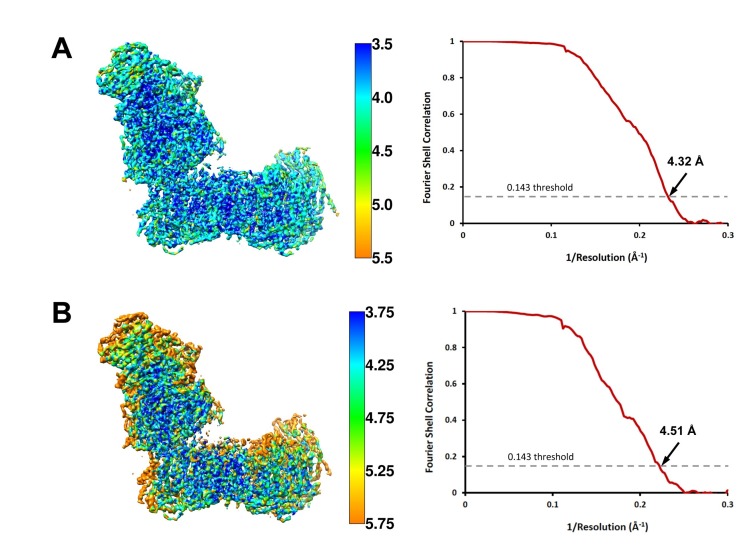
Figure 2. Local resolution and Fourier shell correlation (FSC) curves of (A) deactive complex I and (B) complex I under steady-state turnover conditions.
Left: cryo-EM maps of complex I analysed by ResMap (Kucukelbir et al., 2014) coloured according to local resolution. Right: FSC plots of final masked and refined cryo-EM maps. The map resolution is indicated by the point where the curve crosses the 0.143 threshold (Rosenthal and Henderson, 2003).

