. 2018 Oct 2;7:e39213. doi: 10.7554/eLife.39213

Figure 3. Cryo-EM map of deactive complex I with fitted models.

(A) Selected regions of the matrix domain. (B) A horizontal cross-section through the membrane arm shows TMH fits. (C) A region of the accessory LYR protein subunit NB4M (Angerer et al., 2017); the acyl chain appended to the phosphopantetheine group of the adjacent acyl carrier protein ACPM1 inserts into the interior of NB4M. Cofactor and acyl chain are drawn as ball-and-stick model.

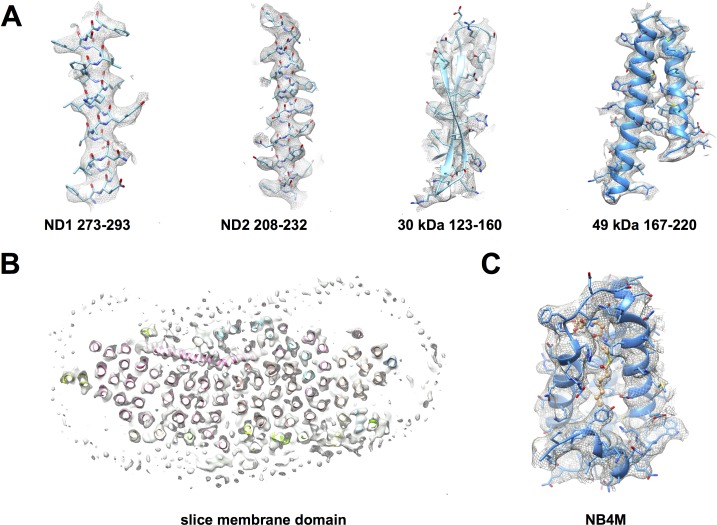
Figure 3.

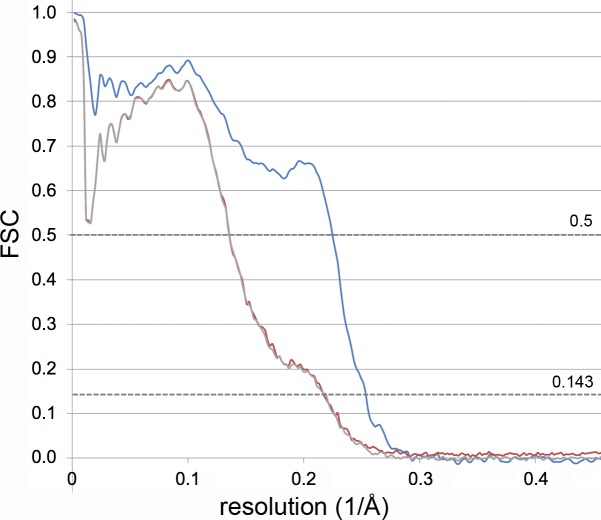
Figure 3—figure supplement 1. Validation of model refinement.

Figure 3—figure supplement 1.

The FSC curve between the final refined model and the reconstruction from all particles of the deactive data set (blue) indicates a resolution of 4.5 Å. The model was scrambled by random displacement of the atoms up to 0.5 Å and refined against half map 1 to 4.3 Å. The FSC between the refined model and half map 1 (FSCwork, red), and between this model and the reconstruction from the other half of the particles (FSCfree, grey) both indicate the same resolution (4.6 Å) and are similar over the full resolution range, showing that no overfitting of the model to the map has taken place.