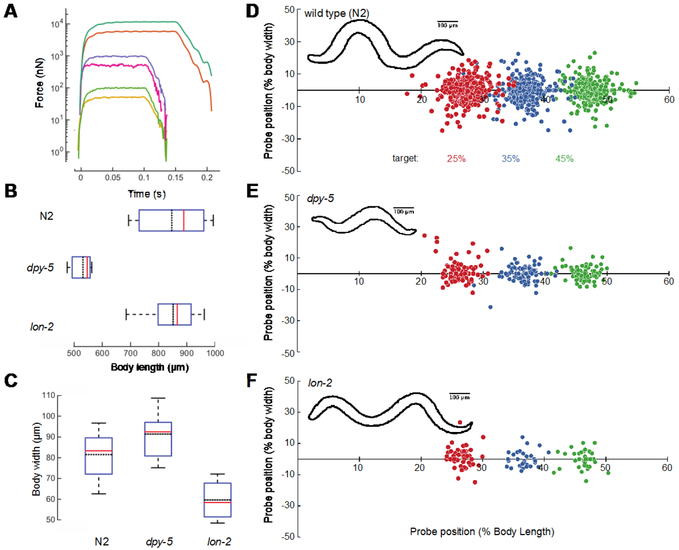
Figure 3. Precision and robustness of force applied and position by HAWK.
A) Single, representative force profiles applied to freely moving worms spanning 50 nN to 10,000 nN. For larger forces, we extended the pulse length to 150 ms to account for the longer rise time required to reach full stimulus strength. B) Body length measurements of wild type (N2), dpy-5, and lon-2 animals determined from the length of the midline. C) Body width measurements made at 50% of the body length for all three genotypes. Box plots show median (red line), the 25% and 75% percentiles and whiskers at 10% and 90% percentiles; the black dotted line is mean. N = 66, 15, and 14 measurements from 33 wild type, 4 dpy-5, and 5 lon-2 animals. D-F) Stimulus location at stimulus onset according percent of the body length and width from the midline for wild type across all trials from 33 wild type, 4 dpy-5, and 5 lon-2 animals (8-12 trials per location per animal) (D), dpy-5 (E), and lon-2 (F). The sign of the y-coordinate is assigned randomly. Circle color indicates the desired target position (in %): 25 (red), 35 (blue), 45 (green). Insets show representative body contours for each genotype.

