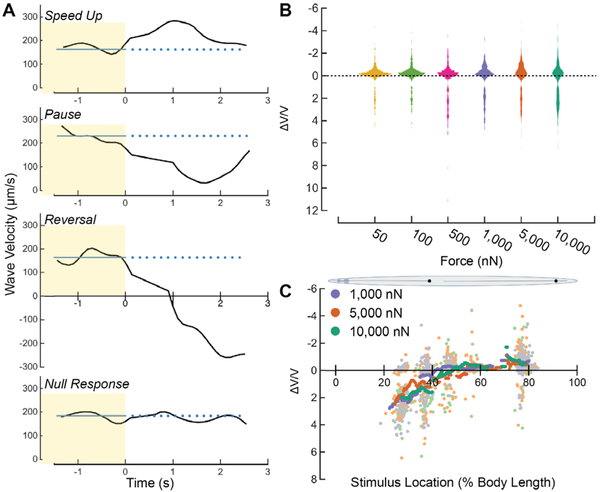
Figure 4. C. elegans adults execute a speed-up, pause, reversal or null response as a function of stimulus strength and location.
A) Velocity vs. time for four typical behavior responses (speed-up, pause, reversal, response failure). t=0 is the stimulus start time. The blue line indicates the pre-stimulus average velocity. B) Violin plot showing the distribution of ΔV/V vs. stimulus strength, pooled across all stimulus amplitude. Width of plot represents the relative distribution of ΔV/V. C) Running average of ΔV/V vs. stimulus location across all trials for high stimulus strengths. Each light point corresponds to an individual stimulus application while the dark points correspond to the running average ΔV/V from all trials with a stimulus location inside a window size of 7.5% of body length around the location specified on the x-axis. Data above and below ΔV/V = 0 in B and C correspond to speed-ups and reversals, respectively (see Methods).

