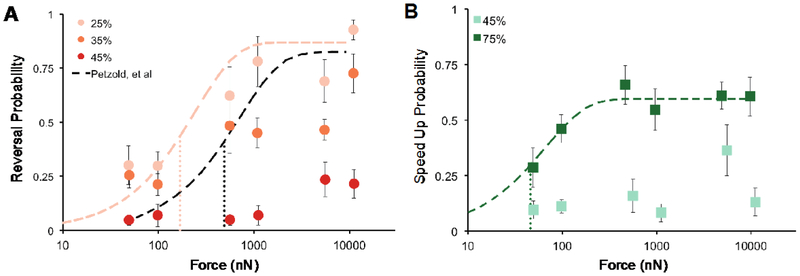
Figure 5. Response type and probability depend on stimulus position.
A) Reversal probability vs. force for anterior touch. Black dotted line is the fit to the data representing reversal probability from Petzold, et al. 25. Pink dotted line was fit to the values recorded at the 25% target. B) Speed-up probability vs. force for posterior targets. Green dotted line was fit to the values recorded at the 75% target. Points are the mean response rate ± s.e.m of at least 6 animals. Each animal was tested during at least 4 trials. All fits were performed according to, f(x) = a(1-e−bx), weighted by the inverse of the variance to the means 25. Finely dotted vertical lines indicate F1/2 for the respective fit. The values were for 25% and 75% were 168 (95% Confidence Interval: 5.2 – 936) and 46 (95% Confidence Interval: 32 – 63) nN, respectively. We calculated the error in F1/2 by analytically solving for the force that gave the 95% confidence intervals around the half maximal response probability, as determined by the fit error.

