
Figure 7. spc-1(dn) transgenics have a lower reversal probability across a wide range of force, but reversals that occur are quantitatively similar to wild type.
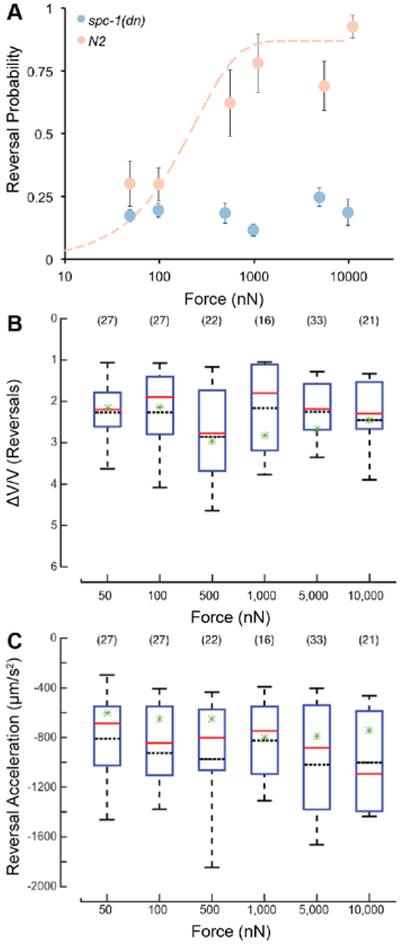
A) Reversal probability vs. force of wild type (peach) and spc-1(dn) (blue) at 25% body length target. Data for wild type are the same as those in Figure 5A and are re-plotted here for clarity. Points are the mean response rate ± s.e.m. of at least 7 animals at each force-position combination. Each animal was tested during at least 9 trials. B) Distributions of ΔV/V vs. force applied for trials where the animal exhibited a reversal. C) Distributions of reversal acceleration vs. force applied for trials where the animal exhibited a reversal. (B-C) Solid, red lines are the median of the distribution; black dotted lines are the mean of the distribution. Green stars indicate the mean for the respective metric from the wild type animal. The bounds of the boxes are the 25% and 75% percentiles. The whiskers are the 10% and 90% percentiles. The sample size is shown in parentheses above each box.