Fig. 4.
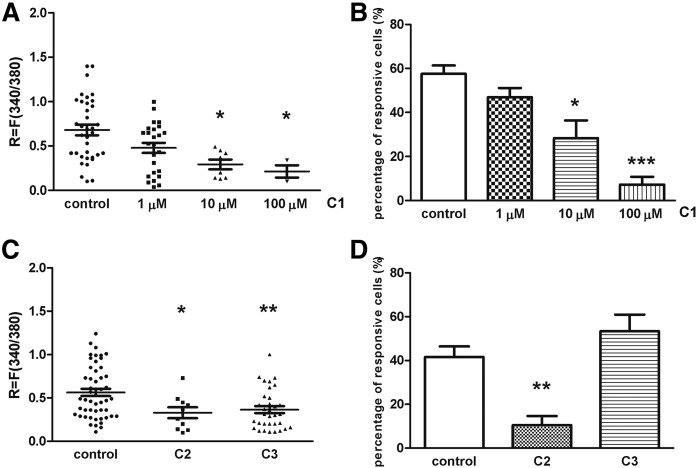
Effect of steroid compounds on TRPV1 receptor activation induced by capsaicin (CAPS) on cultured TG sensory neurons. A: Change in the fluorescence ratio (R = F340/F380) is presented after 1, 10, and 100 µM C1 treatment. Dot plot represents mean ± SEM. * P < 0.05 (Kruskall-Wallis test with Dunn’s posttest, C1-treated vs. control). n = 32–100 cells per group. B: Percentage of responsive cells to capsaicin is presented after 1, 10, and 100 µM C1 administration. Ca2+ responses are presented in percent of total number of examined neurons. * P < 0.05; *** P < 0.001 (Kruskall-Wallis test with Dunn’s posttest, C1-treated vs. control). n = 32–100 cells per group. C: Change in the fluorescence ratio (R = F340/F380) is presented after 100 µM C2 and C3 treatment. Dot plot represents mean ± SEM. * P < 0.05; ** P < 0.01 (Kruskall-Wallis test with Dunn’s posttest, C2- or C3-treated vs. control). n = 60–96 cells per group. D: Percentage of responsive cells to capsaicin is presented after 100 µM C2 and C3 administration. Ca2+ responses are presented in percent of total number of examined neurons. ** P < 0.01 (Kruskall-Wallis test with Dunn’s posttest, C2-treated vs. control). n = 60–96 cells per group.

