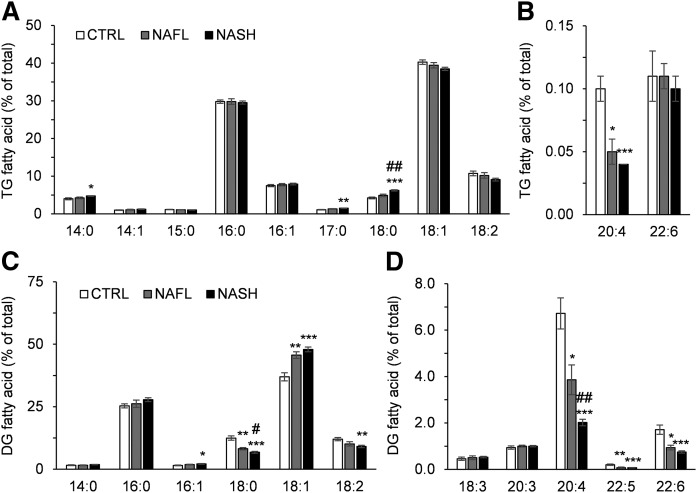
Fig. 2.
FA composition of hepatic TG and DG in the CTRL, NAFL, and NASH groups. FAs comprising hepatic TG (A, B) and DG (C, D) are shown as the percent of total FA of the respective lipid classes in the CTRL (white bars), NAFL (gray bars), and NASH (black bars) groups. The FAs with high and low abundance in TG are presented in A and B, while the FAs with high and low abundance in DG are presented in C and D. All values are expressed as mean ± SEM. Data were analyzed with the Kruskal-Wallis test and corrected for multiple comparisons with the Benjamini-Hochberg approach. The Mann-Whitney U test corrected with the Dunn-Sidak approach was used for the post hoc analysis (n = 16 for CTRL; n = 10 for NAFL; n = 32 for NASH). *P < 0.05, **P < 0.01, *** P < 0.001 versus CTRL; #P < 0.05, ##P < 0.01 versus NAFL.

