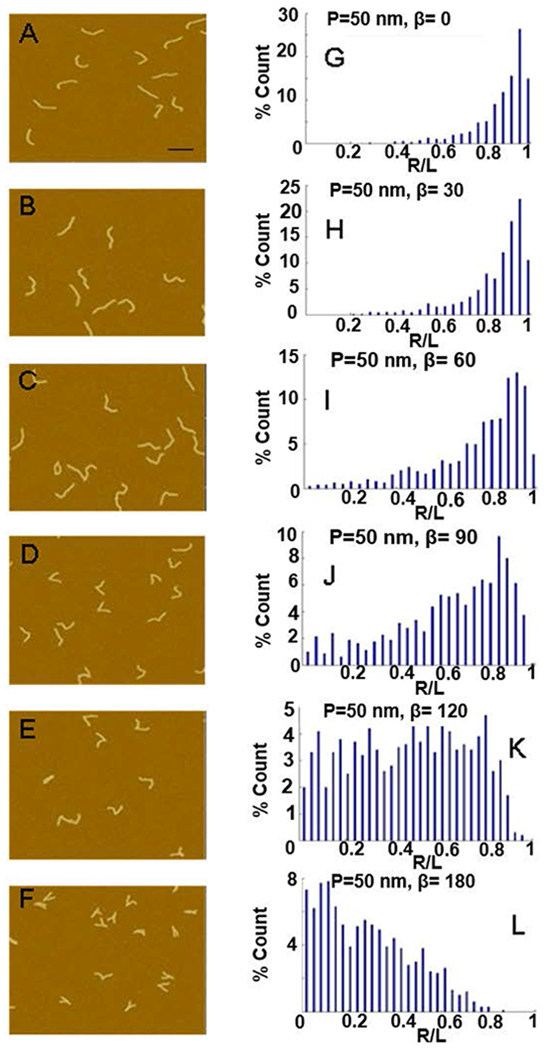
Figure 2.

Effect of varying bend angle on end-to-end distance distributions. (A-F) Images of simulated DNA molecules for P = 50 nm and varying the bend angle, β, from 0 – 180°; scale bar is 100 nm. (G-L) The resulting R/L distribution for the molecules simulated in A-F.
