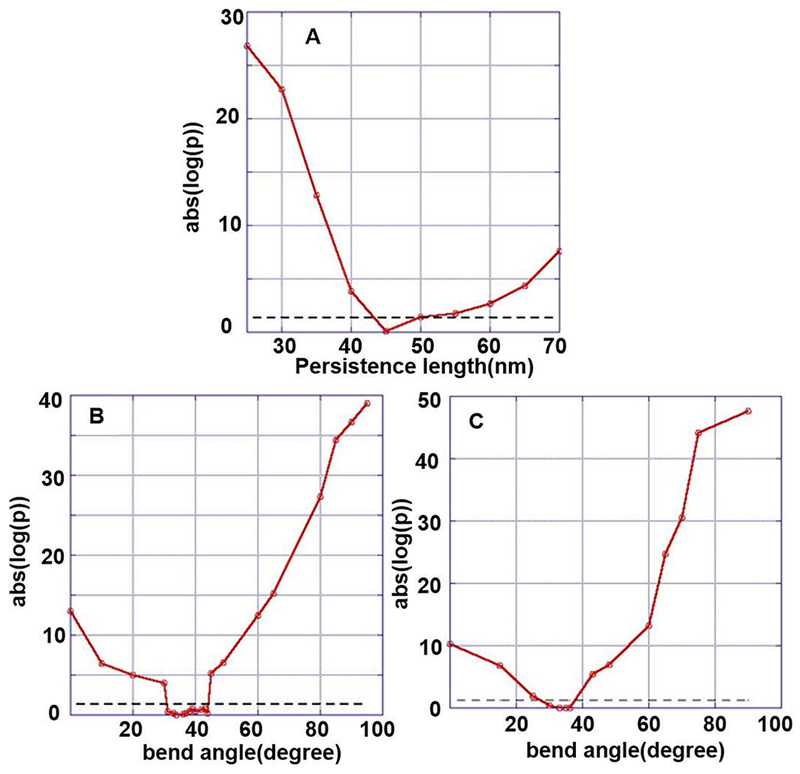
Figure 6.

Plot of the p value showing the quality of the fit between the simulated and the experimental data and the acceptable fit region (region of uncertainty lying below dashed lines). (A) Normal DNA with P = 45 nm, β = 0°; (B) cisplatinated DNA with GG in the middle of the strand, P = 45 nm, acceptable fits are obtained for β = 30° – 44°; (C) cisplatinated DNA with GG in the middle of the strand, P = 45 nm, P’ = 20 nm, acceptable fits are obtained for β = 30° – 38°; best fit is obtained for β = 36°.
