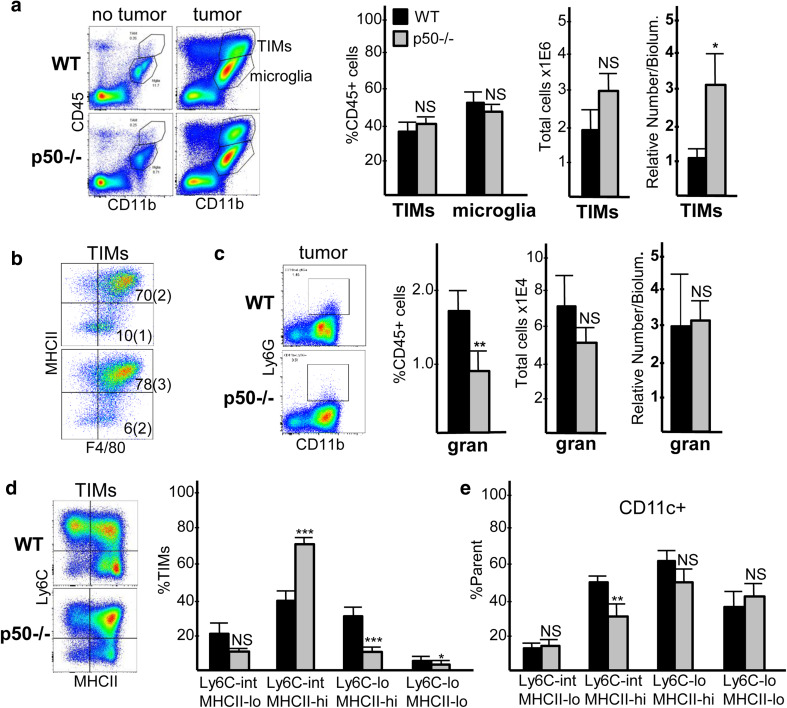
Fig. 2.
Characterization of glioma myeloid cells. a Representative CD11b;CD45 FC data for brain cells from control and tumor-bearing mice isolated on day 14 after GL261-Luc inoculation, with TIM and microglia populations indicated (left). TIMs and microglia were quantified as a percent of CD45+ cells, and TIMs were also quantified as total number per tumor or by their numbers per bioluminescence upon IVIS imaging, in relative units, as a measure of tumor size (right, mean and SE from ten determinations). b Representative MHCII;F4/80 FC data for TIMs, with mean indicated (SE in parenthesis) for the percent of cells in the upper right and lower right quadrants. c Representative Ly6G;CD11b plots within tumor CD45+ gate (left). Ly6G+ cells were quantified as percent of CD45+ cells, total number per tumor, and by the number per bioluminescence unit (right, mean and SE from three determinations). d Representative Ly6C;MHCII FC plots within the TIM gate (left). The indicated Ly6C;MHCII subsets were quantified as percent of TIMs (right, mean and SE from ten determinations). e Percent of each Ly6C;MHCII subset expressing CD11c (mean and SE from four determinations)

