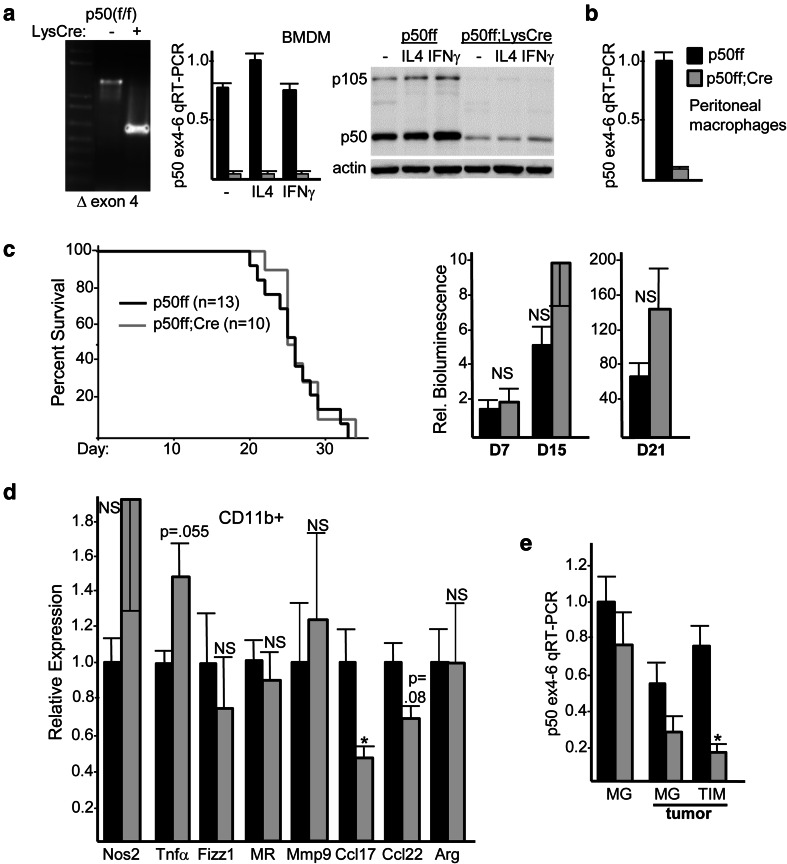
Fig. 6.
Glioma growth is not slowed in mice lacking myeloid NF-κB p50. a PCR analysis of genomic DNA from p50(f/f) and p50(f/f);Lys-Cre mice (left). RNA isolated from BMDM under basal conditions in CSF1 or after stimulation for 24 h with IL-4 (M2 inducer) or IFNγ (M1 inducer) was analyzed by qRT-PCR using p50 exon 4 and exon 6 primers (center, mean and SE from three determinations); total cellular proteins from the same cultures were analyzed by Western blotting for p50 and β-actin (right). b Peritoneal macrophages from p50(f/f) and p50(f/f);Lys-Cre mice were analyzed for p50 RNA by exon 4–6 qRT-PCR (mean and SE from three determinations). c Survival curves of p50(f/f) vs p50(f/f);Lys-Cre mice inoculated on day 0 with GL261-Luc cells, with total number of mice in each group and Log Rank p values shown (left). Relative IVIS bioluminescence of tumors on days 7, 15, and 21 from the same mice used for survival analysis (right). d RNAs prepared from tumor CD11b+ cells on day 14 after GL261-Luc inoculation were subjected to qRT-PCR analysis for indicated M1 and M2 markers. The relative expression of each mRNA, normalized to cyclophilin A, is shown, with expression in p50(f/f) mice set to 1.0. Mean and SE are shown for three mice per group. e p50 RNA expressed was evaluated by exon 4–6 qRT-PCR in microglia (MG) from tumor-free mice and in MG and TIMs sorted from tumors 14 days after GL261 inoculation (mean and SE from three determinations)

