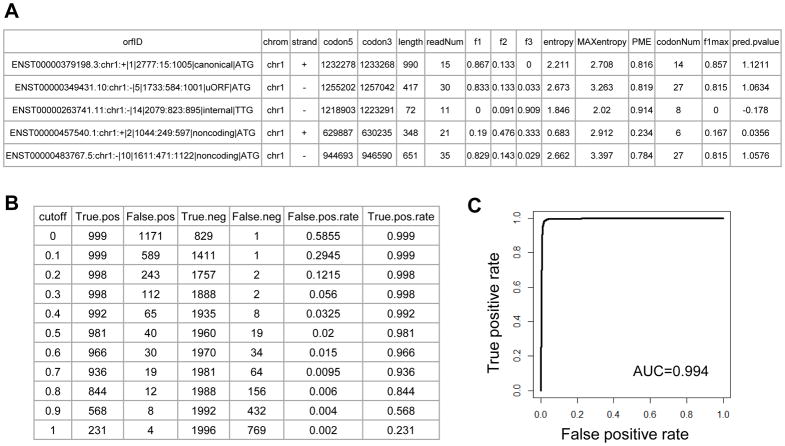
Figure 5.
Example outputs of RibORF program and algorithm performance evaluation. (A) Example candidate ORFs with training parameters and predicted translated P-values. These values were shown in the files “pred.pvalue.parameters.txt” and “repre.valid.pred.pvalue.parameters.txt”. (B) The predicted translated P-value cutoffs and associated statistics of true positive, false positive, true negative, false negative, false positive rate and true positive rate, as shown in the “stat.cutoff.txt” file. (C) The ROC curve showing the performance of the RibORF program in identifying translated ORFs. The plot was shown in the “plot.ROC.curve.pdf”. The AUC value was shown in the plot.

